Where Does Money Go When Stock Prices Drop?
Posted on
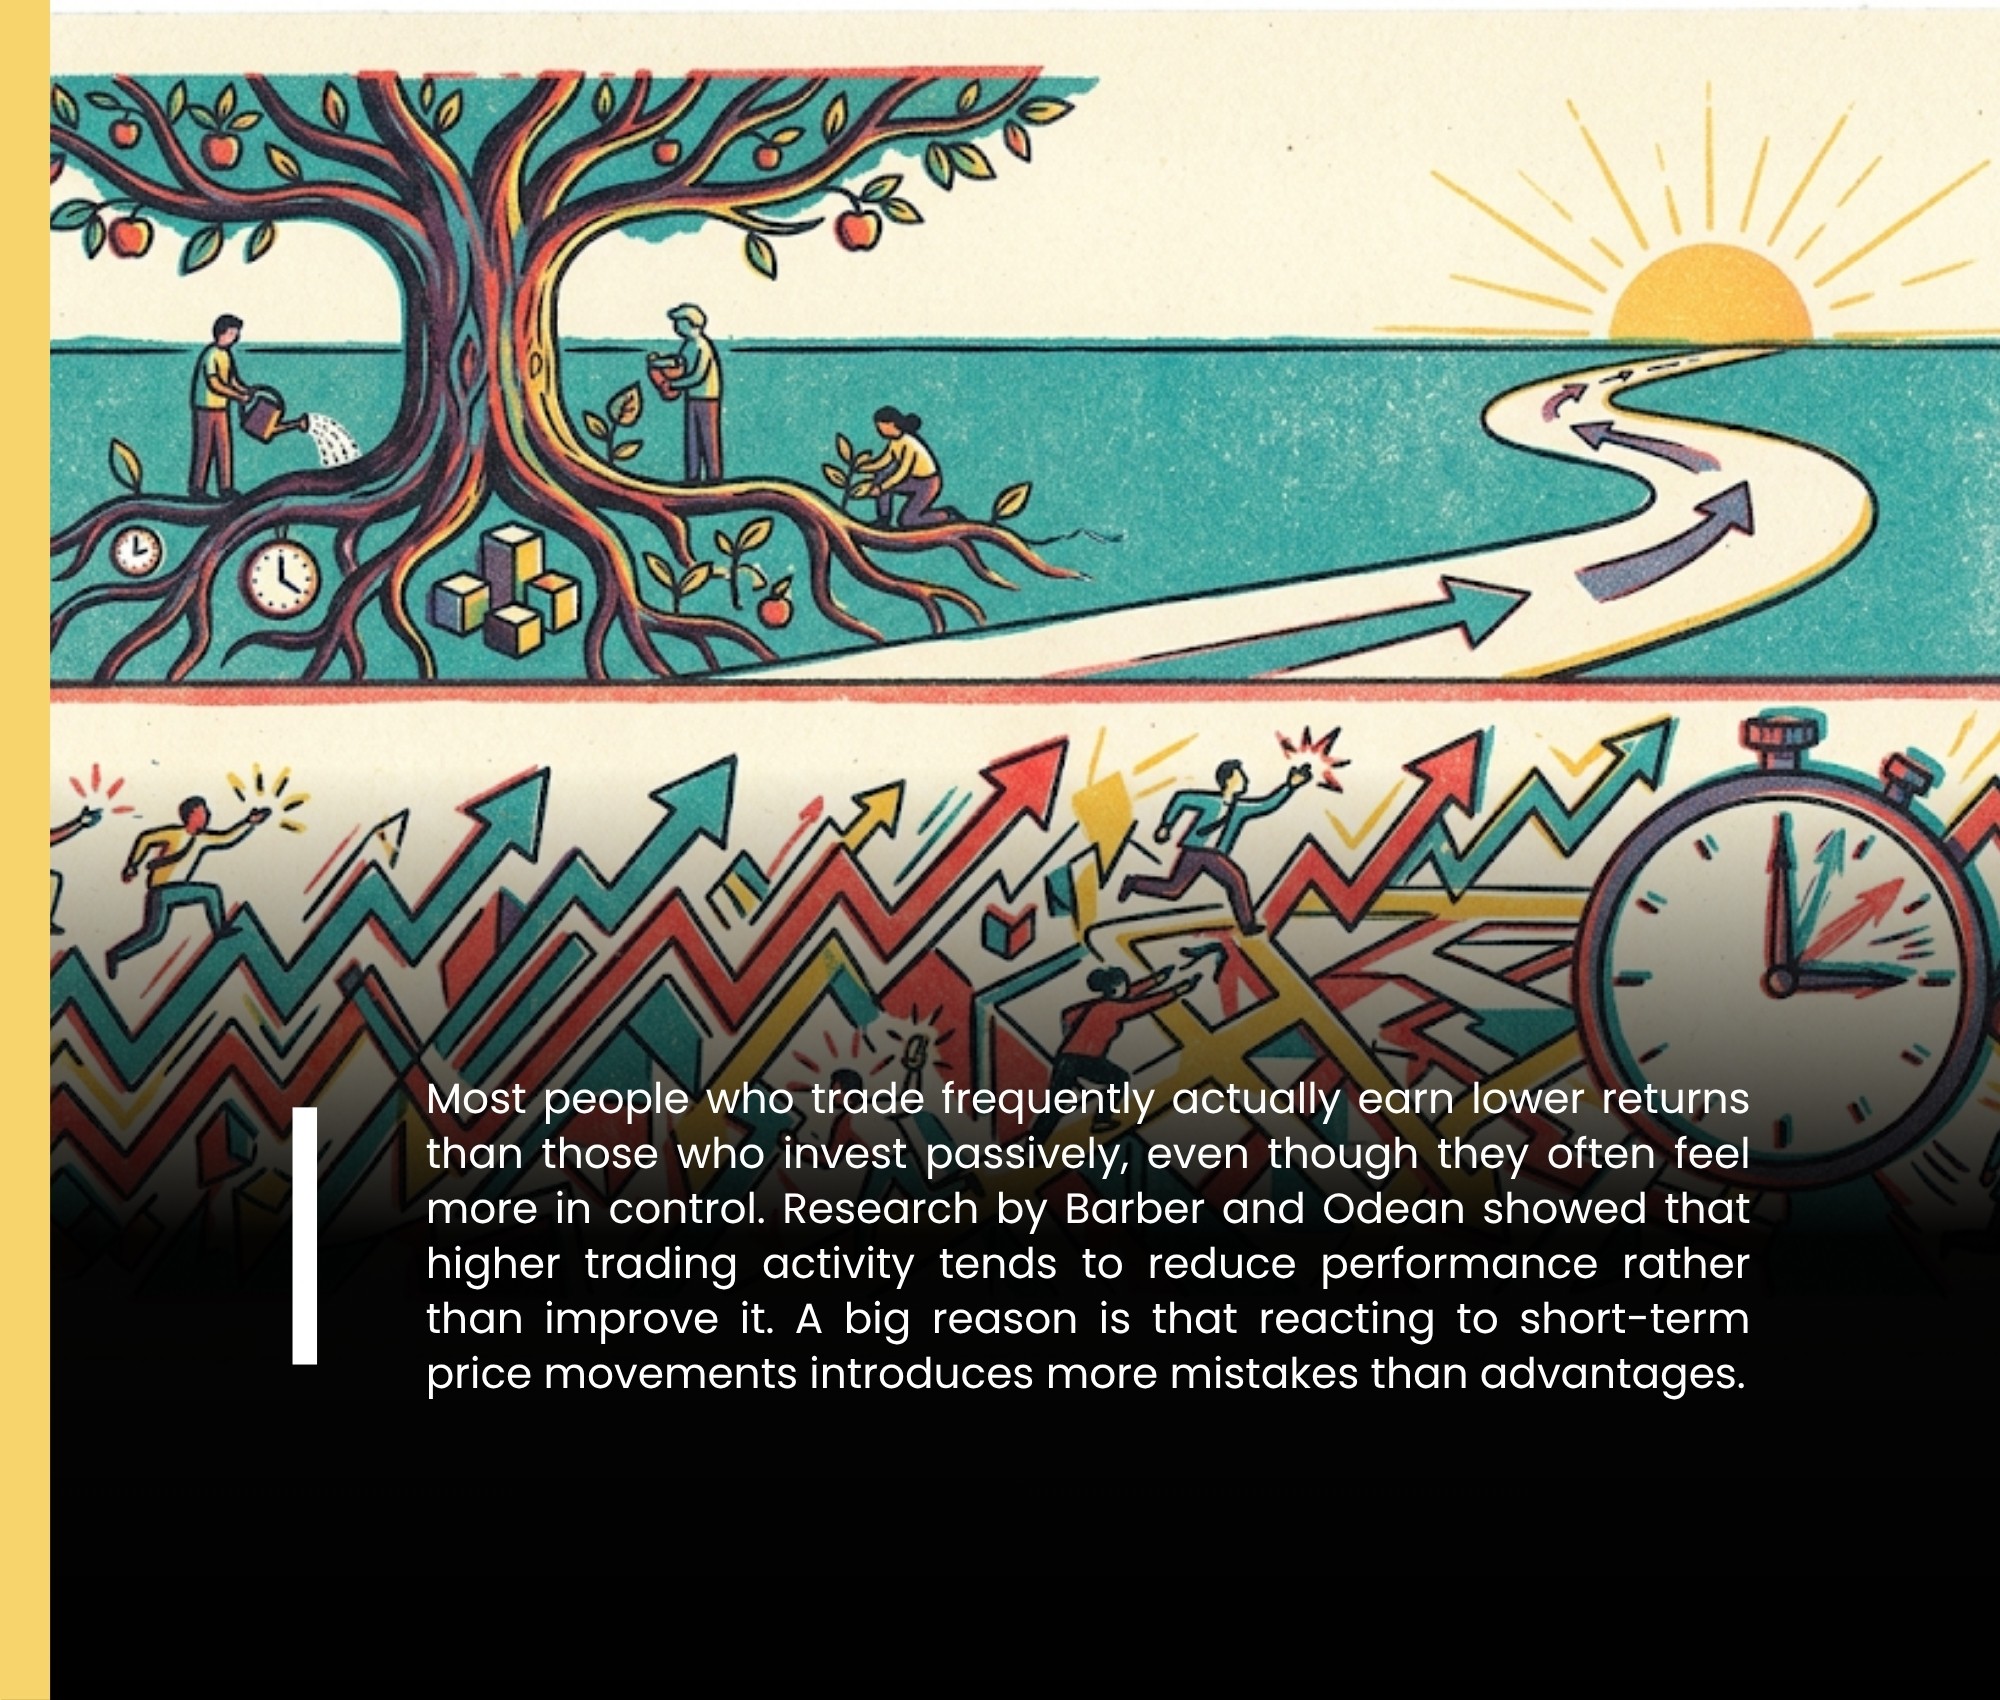
Start Investing
Posted at

Vanishing Money Myth in Stock
Investors often ask one question during market turbulence: where does the money go when stock prices drop? Headlines scream about trillions wiped out, yet the cash never seems to vanish into thin air. This common confusion stems from a fundamental misunderstanding of how stock markets function. Money does not disappear. Instead, perceived value shifts, capital transfers between participants, and opportunities emerge for prepared investors.
Consider a simple case. You own 100 shares of a company trading at 100 dollars each, for a 10,000 dollar position. The price falls to 80 dollars. Your holdings now show 8,000 dollars on paper. Did 2,000 dollars evaporate? No. The market capitalization declined because fewer buyers stand willing to pay the prior price. Sellers who exit receive cash from new buyers at the lower level, while long-term holders who stay put experience only an unrealized adjustment in valuation.
This dynamic matters deeply for retail investors and serious market participants alike. Understanding it prevents panic selling at bottoms and reveals buying chances when fear dominates. At its core, stock prices reflect the latest agreement between a willing buyer and a willing seller. When sellers outnumber buyers, often due to negative news, economic data, or sentiment shifts, prices adjust downward until balance restores.
The question of where the money goes when stock prices drop highlights a key truth about markets. They operate on supply and demand, not fixed pots of capital. Declines destroy paper wealth for non-selling holders but transfer real cash in every completed trade. Short sellers can generate gains, institutions rotate portfolios, and value seekers deploy fresh capital at discounted levels.
The Mechanics Behind Stock Price Movements and Liquidity
Stock exchanges match buyers and sellers through continuous auctions. Bid prices represent what buyers offer, ask prices what sellers demand. When more sellers hit the market at current levels, the price ticks lower to attract buyers. No central vault holds the "lost" value. Each transaction simply exchanges shares for cash at the prevailing price.
Liquidity plays a central role. In highly liquid stocks, small orders barely move prices. In thinner markets or during stress, even moderate selling can trigger sharp drops. Market makers and high-frequency participants provide interim liquidity but withdraw in extreme volatility, amplifying moves.
Perception drives much of the action. A company with unchanged fundamentals can see its price halve if investors revise growth expectations or risk assessments. The market capitalization, calculated as shares outstanding times current price, falls accordingly. Yet the company's assets, cash flows, and operations remain intact. This explains why recoveries often follow once sentiment improves.
Key factors influencing price declines include:
Negative earnings surprises or guidance cuts
Broader economic slowdown signals
Rising interest rates that make bonds more attractive
Geopolitical events or sector-specific shocks
Algorithmic and momentum-driven selling
In all cases, the money exchanged stays within the system. Sellers receive cash from buyers. The difference lies in the price level at which the exchange occurs.
Here is a straightforward transaction data table illustrating a price drop scenario:
Scenario | Original Purchase Price | Current Trading Price | Shares Traded | Seller Receives | Buyer Pays | Net Effect on Market |
|---|---|---|---|---|---|---|
Seller exits position | $100 | $80 | 100 | $8,000 | - | Realizes $2,000 paper loss |
New buyer enters | - | $80 | 100 | - | $8,000 | Acquires shares at discount |
Long-term holder stays | $100 | $80 | 0 | $0 | $0 | Unrealized $2,000 decline |
This table shows clearly that cash moves from the buyer to the seller. The "lost" 2,000 dollars per 100 shares represents only the gap between prior expectations and current willingness to pay.
Market participants often overlook that most shares never trade on any given day. The price reflects marginal trades, yet it revalues all outstanding shares. That creates the illusion of massive wealth destruction across the entire market.
Short Selling, Panic, and Perceived Losses
A persistent myth claims money vanishes during crashes. In reality, only expectations adjust. If no one sells, no actual cash leaves the market. Paper losses remain unrealized until positions close.
Short selling adds another layer. Short sellers borrow shares, sell them immediately at the current price, then buy back later, ideally cheaper, to return them. Their profit equals the price difference minus fees.
Example: A short seller borrows 100 shares at 100 dollars, sells for 10,000 dollars cash. Price falls to 60 dollars. The short buys back for 6,000 dollars, returns shares, and pockets 4,000 dollars profit (before costs). This gain comes from the market's repricing, not directly from any single long investor's pocket. It reflects successful anticipation of declining demand.
Critics argue shorts exacerbate drops, yet they also provide liquidity and express bearish views that can accelerate necessary corrections.
Common misconceptions include:
All market value loss equals cash permanently gone (false, most is unrealized)
Crashes mean systemic money destruction (false, capital rotates or waits on sidelines)
Only sellers lose (false, new buyers lock in lower cost basis for future gains)
Institutional investors often sell into weakness to rebalance or meet redemptions. Retail investors may panic and lock in losses. Both actions transfer shares to calmer hands willing to hold through volatility.
During the 2020 COVID-19 crash, the S&P 500 fell 34 percent in 23 days. Trillions in market value disappeared on paper, yet stimulus and vaccine progress sparked one of the fastest recoveries on record. Money did not vanish. It shifted to cash or bonds temporarily before returning to equities at better entry points.
Short interest data, available on many platforms, often spikes before or during declines, signaling professional positioning rather than random destruction.
A risk table helps frame potential downsides in declining environments:
Risk Type | Description | Typical Impact | Mitigation Approach |
|---|---|---|---|
Market-wide sentiment shift | Broad fear or economic data triggers widespread selling | Portfolio value drops 10-30 percent or more | Maintain long-term horizon, avoid margin |
Company-specific news | Earnings miss or scandal | Individual stock falls 20-50 percent | Diversify across 10-20 holdings |
Liquidity crunch | Thin trading leads to exaggerated moves | Gaps down on open | Use limit orders, avoid illiquid names |
Short squeeze reversal | Heavy short covering pushes prices up unexpectedly | Temporary relief but volatility | Monitor short interest ratios |
Opportunity cost | Holding cash too long misses rebound | Underperformance vs benchmark | Dollar-cost average into quality names |
This table underscores that risks exist on both sides of a price drop, rewarding disciplined approaches.
Capital Flow Patterns in Major Market Declines
History provides the best laboratory for understanding where the money goes when stock prices drop. Major events reveal consistent patterns: rapid repricing, capital rotation to defensive assets, and eventual return to equities for patient capital.
The 1987 Black Monday saw the Dow fall over 22 percent in one day. Program trading and portfolio insurance amplified the move. Market value plunged, yet no money disappeared. Sellers received cash from buyers stepping in at lower levels. The market recovered within two years.
The dot-com bubble burst from 2000 to 2002 erased nearly 49 percent of the Nasdaq. Speculative technology valuations collapsed as earnings failed to materialize. Capital flowed out of growth stocks into value sectors and bonds. Many holders who sold realized losses. Those who held quality companies through the period eventually recovered as the economy adapted.
The 2008 global financial crisis delivered a 57 percent peak-to-trough decline in the S&P 500 over 17 months. Housing and banking sectors led the rout. Trillions in perceived wealth vanished on paper. Banks and institutions sold assets to raise capital. Short sellers in financials profited handsomely. Government interventions and quantitative easing later returned liquidity, lifting prices. Full recovery to new highs took about four years.
The 2020 COVID crash stands out for speed. A 34 percent S&P 500 drop occurred in just 23 trading days. Fear of lockdowns dominated. Money rotated into cash, Treasuries, and gold. Once fiscal and monetary support clarified, buying resumed at discounted valuations. Recovery to new highs came within months, rewarding those who deployed capital during the panic.
Here is a historical data table summarizing key events:
Event | Year | Peak-to-Trough Drop (%) | Approximate Market Cap Loss (at time) | Recovery to New High (Years) | Key Capital Flow Observation |
|---|---|---|---|---|---|
Black Monday | 1987 | 22.6 (one day) | Hundreds of billions | ~2 | Quick rebound, liquidity returned fast |
Dot-com Burst | 2000-2002 | 49 (Nasdaq) | ~5 trillion | ~7 for Nasdaq | Rotation out of tech to value |
Global Financial Crisis | 2007-2009 | 57 | ~11 trillion | ~4 | Government backstops stabilized flows |
COVID-19 Crash | 2020 | 34 | ~10 trillion (brief) | ~0.5 | Fastest recovery due to stimulus |
These episodes confirm that money rotates rather than disappears. Cash holders gain purchasing power as assets cheapen. Short participants capture gains. Long-term investors who average in during weakness build larger positions at lower average costs.
Capitalizing on Declines and Risk Management
Smart investors treat price drops as potential entry points rather than exit signals. The key lies in separating temporary sentiment from permanent impairment of business value.
Core strategies include:
Dollar-cost averaging: Invest fixed amounts regularly to lower average cost basis
Focus on quality fundamentals: Strong balance sheets, consistent cash flow, competitive moats
Rebalance portfolios toward undervalued sectors
Maintain cash reserves for opportunistic buying
Use tax-loss harvesting to offset gains elsewhere
A valuation table demonstrates the opportunity in declines, assuming stable fundamentals for a hypothetical company:
Metric | Pre-Drop Valuation | Post-Drop Valuation | Investor Action Implication |
|---|---|---|---|
Share Price | $100 | $60 | 40 percent discount |
Earnings Per Share (trailing) | $4 | $4 (unchanged) | P/E falls from 25x to 15x |
Discounted Cash Flow Intrinsic Value (5 percent growth, 10 percent discount rate) | $95 | $95 (fundamentals same) | Margin of safety increases to 37 percent |
Dividend Yield | 2 percent | 3.3 percent | Higher income on new purchases |
This table shows how a price drop, with no change in underlying business, improves prospective returns for new capital. Investors comparing current multiples to historical or peer averages can identify mispricings.
Combine this with the risk table from earlier to build resilient portfolios. Diversification across asset classes limits drawdowns. For example, bonds often rise when stocks fall, providing natural offsets.
Serious investors also monitor margin debt levels and put-call ratios for sentiment extremes. Extreme fear readings frequently mark capitulation points where money begins flowing back into equities.
The strategic takeaway is clear. Price drops represent wealth transfers from impatient or leveraged participants to disciplined, cash-rich investors. Those who understand the mechanics avoid emotional decisions and position for the inevitable recovery phase that follows every decline.
In summary, when stock prices drop, the money does not vanish. It moves from optimistic prior buyers (via unrealized losses) to new buyers at better prices, or to short sellers who anticipated the shift, or simply sits in cash awaiting better risk-reward setups. Market capitalization adjusts to reflect collective new expectations, but the underlying economy and corporate earnings potential endure.
Prepared investors at Stock Profit Club view these periods as essential parts of the wealth-building cycle. They preserve capital, deploy it thoughtfully, and emerge stronger on the other side.