What is Technical Analysis
Posted on
Start Trading
Posted at

Introduction
Technical analysis (TA) is a method used by traders and investors to evaluate and predict future price movements of financial assets, stocks, forex, cryptocurrencies, commodities, and more, primarily by studying historical price charts, trading volume, and various statistical indicators. Unlike fundamental analysis, which focuses on a company’s financial health, earnings, and economic factors, technical analysis assumes that all relevant information is already reflected in the price. It treats the market as a psychological battlefield where supply, demand, fear, greed, and crowd behavior create repeatable patterns.
Traders who rely on TA are often called “chartists.” They believe that price action reveals everything worth knowing and that history tends to rhyme, if not repeat exactly. With the rise of online brokerages, real-time charting platforms like TradingView, and algorithmic trading, technical analysis has become one of the most accessible and widely used approaches in modern markets. Professional hedge funds, day traders, swing traders, and even long-term investors incorporate TA elements into their decision-making.
At its core, technical analysis answers three practical questions:
What is the current trend?
Where might the price go next?
When should I enter or exit a trade?
TA operates on the belief that markets are driven by human emotions that produce recognizable patterns. A sudden surge in buying volume often precedes an uptrend; heavy selling at a previous high frequently creates resistance. By visualizing these forces on a chart, traders attempt to ride momentum rather than fight it.
The beauty of TA lies in its universality. Whether you trade Apple stock, EUR/USD, Bitcoin, or crude oil futures, the same tools apply. It works across time frames, from 1-minute scalping charts to monthly long-term views, and across asset classes.
A quick comparison helps highlight its strengths:
Aspect | Technical Analysis | Fundamental Analysis |
|---|---|---|
Focus | Price action, volume, patterns | Earnings, balance sheets, economic data |
Time horizon | Short- to medium-term (minutes to months) | Long-term (months to years) |
Data used | Historical charts and indicators | Financial statements, news, ratios |
Main goal | Timing entries/exits and identifying trends | Determining intrinsic value |
Best for | Day/swing traders, momentum plays | Value investors, buy-and-hold |
Subjectivity | Moderate (pattern recognition) | Lower (numbers-based) |
Many successful traders combine both: they use fundamentals to select what to trade and technicals to decide when.
In practice, a retail trader might spot a stock breaking above a key resistance level on high volume and enter a long position with a stop-loss just below that level. Institutional algos scan thousands of securities per second looking for the same setups. This democratization of tools has made TA more powerful, and sometimes self-reinforcing, than ever before.
The History and Evolution of Technical Analysis
Technical analysis is far older than most people realize. Its earliest documented roots trace back to 18th-century Japan. Legendary rice trader Munehisa Homma (1724–1803) developed candlestick charting techniques while trading at the Osaka Rice Exchange. By recording open, high, low, and close prices in visual “candles,” Homma could see supply-demand imbalances at a glance. His methods helped him amass a fortune estimated (in today’s terms) at over $100 billion, making him one of history’s most successful traders.
The modern Western version of TA began in the late 19th century with Charles Dow, co-founder of Dow Jones & Company. Between 1884 and 1902, Dow published editorials in The Wall Street Journal outlining what became known as Dow Theory. Its six basic tenets remain foundational:
The market discounts everything.
There are three types of trends: primary, secondary, and minor.
Trends have three phases: accumulation, public participation, and distribution.
Volume must confirm the trend.
Averages must confirm each other (e.g., Industrials and Transportation).
Trends persist until clear reversal signals appear.
Dow’s ideas were later expanded by William Hamilton, Robert Rhea, and others. In the 1930s, Ralph Nelson Elliott introduced Elliott Wave Theory, proposing that markets move in predictable five-wave impulse and three-wave corrective patterns driven by collective psychology. Around the same time, Japanese candlestick methods finally reached the West thanks to trader Steve Nison’s books in the 1990s.
The computer revolution of the 1980s and 1990s supercharged TA. Suddenly, anyone with a PC could plot dozens of indicators in real time. Today, machine-learning models scan for patterns faster than any human, yet the core principles remain unchanged: price, volume, and psychology.
Core Principles and Assumptions
Three pillars support almost every technical method:
Market Action Discounts Everything Prices already reflect all known news, earnings, geopolitics, and sentiment. A surprise earnings beat? The chart will show it immediately through a gap or volume spike.
Prices Move in Trends “The trend is your friend until the end when it bends.” Markets rarely move in straight lines; they trend up, down, or sideways. Trend-following strategies attempt to stay on the right side of the dominant direction.
History Tends to Repeat Itself Because human emotions (fear, greed, FOMO, panic) don’t change, certain price patterns reappear across decades and assets.
Key building blocks include:
Support & Resistance: Psychological price floors and ceilings where buying or selling interest clusters.
Trend Lines: Straight lines connecting higher lows (uptrend) or lower highs (downtrend).
Volume: The fuel behind moves. Rising prices on rising volume confirm strength; rising prices on falling volume suggest weakness.
Time Frames: Multiple-time-frame analysis (e.g., daily trend + 4-hour entry) improves accuracy.
These principles are not infallible, markets can remain irrational longer than traders can stay solvent, but they provide a statistical edge when combined with proper risk management.
Essential Tools and Indicators
Chart Types
Line charts: Simple closing-price connections—great for big-picture trends.
Bar charts: Show open, high, low, close (OHLC) for each period.
Candlestick charts: The most popular. Green (or white) candles mean close > open (bullish); red (or black) mean close < open (bearish). The “body” shows the range between open and close; “wicks” show extremes.
Popular Indicators (categorized)
Category | Indicator | What It Measures | Typical Use / Signal | Timeframe Suitability |
|---|---|---|---|---|
Trend | Simple Moving Average (SMA) | Average price over N periods | Golden/Death Cross (50/200-day) | All |
Trend | Exponential Moving Average (EMA) | Weighted recent prices | Faster response to new information | Short/medium |
Momentum | Relative Strength Index (RSI) | Speed & change of price moves | Overbought (>70), Oversold (<30) | 14-period standard |
Momentum | MACD | Relationship between two EMAs | Line crossovers and histogram divergence | All |
Volatility | Bollinger Bands | Volatility bands around SMA | Squeeze = low vol → expansion = breakout | All |
Volume | On-Balance Volume (OBV) | Cumulative buying/selling volume | Divergence warns of trend weakness | Medium/long |
Fibonacci | Retracement/Extension | Key ratios (23.6%, 38.2%, 61.8%) | Potential support/resistance in pullbacks |
Moving Averages are the workhorse of TA. A Golden Cross (50-day SMA crossing above 200-day SMA) is considered a major bullish signal and is watched by millions of traders globally.
RSI helps avoid buying at the top of a rally. When RSI diverges from price (price makes new high but RSI doesn’t), a reversal may be near.
Bollinger Bands contract during quiet periods (“the squeeze”) and expand during volatile breakouts—often preceding explosive moves.
Fibonacci levels derive from the golden ratio and appear magically at turning points in many trending markets.
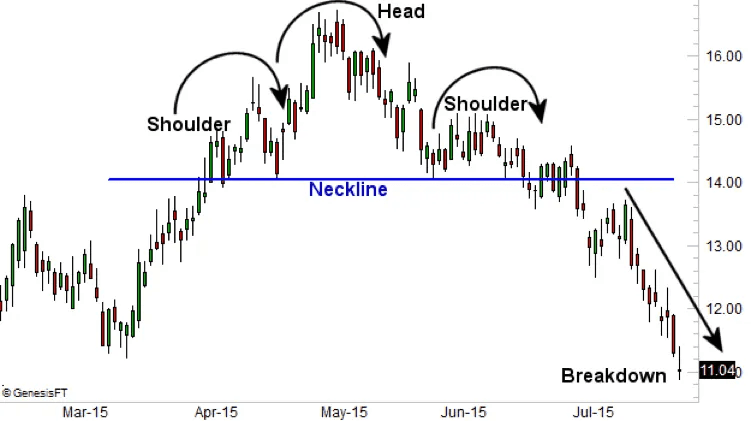
Chart Patterns and Best Practices
Classic Chart Patterns
Pattern Type | Name | Signal | Reliability | Example Context |
|---|---|---|---|---|
Reversal | Head & Shoulders | Bearish | High | After long uptrend |
Reversal | Inverse Head & Shoulders | Bullish | High | After long downtrend |
Continuation | Ascending Triangle | Bullish | Medium-High | Uptrend consolidation |
Continuation | Flags / Pennants | Continuation | High | Brief pause in strong trend |
Reversal | Double Top / Bottom | Reversal | Medium | At major support/resistance |
Neutral | Symmetrical Triangle | Breakout either way | Medium | Indecision |
The Head & Shoulders is one of the most reliable reversal patterns: left shoulder, higher head, right shoulder roughly equal to left, followed by a neckline break.
Common Strategies
Trend Following: Buy pullbacks in uptrends using moving-average support.
Breakout Trading: Enter when price closes above resistance on high volume.
Mean Reversion: Buy oversold RSI in range-bound markets.
Multiple Time-Frame Confirmation: Daily chart for direction, 1-hour for entry.
Advantages of TA
Works in any liquid market
Provides clear, objective entry/exit rules
Excellent for short-term timing
Back-testable with historical data
Limitations
Lagging nature (indicators react after price moves)
False signals (“whipsaws”) in choppy markets
Subject to interpretation bias
Efficient-market critics argue past patterns have no predictive power (though real-world results often differ)
Best Practices
Always use stop-losses (risk no more than 1-2% of capital per trade).
Combine indicators rather than relying on one (e.g., MA + RSI + volume).
Back-test strategies on at least 5–10 years of data.
Keep a trading journal to review emotional decisions.
Never risk money you cannot afford to lose.
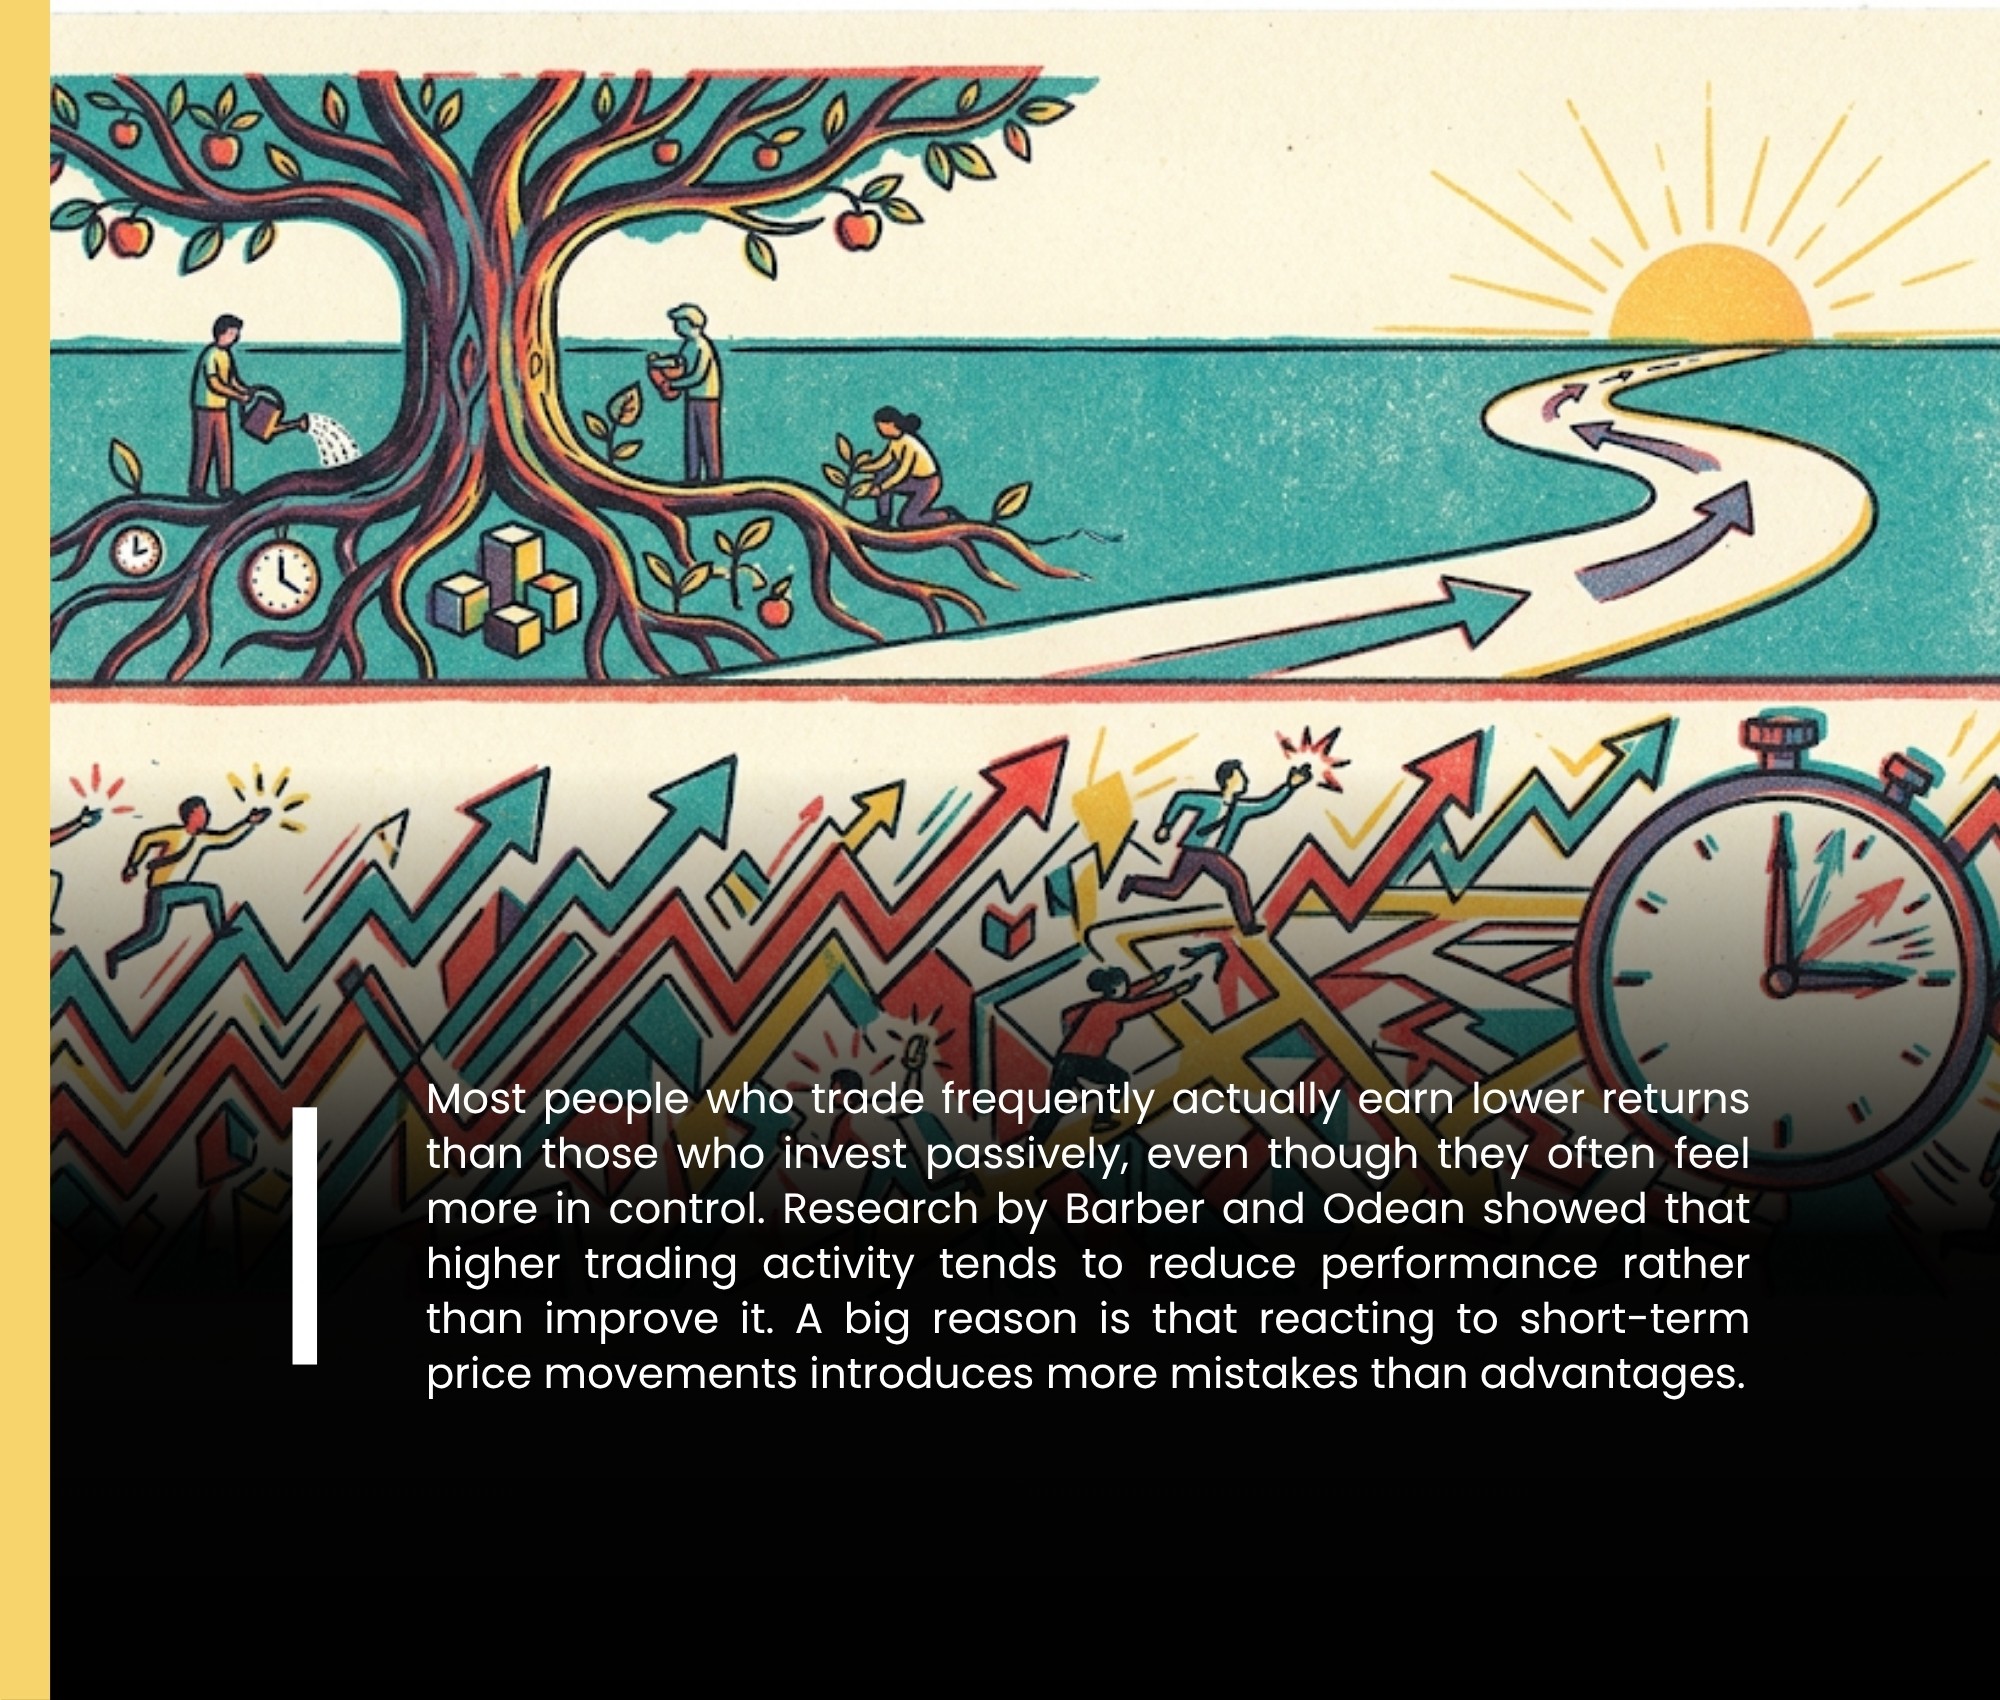
When used responsibly, technical analysis turns random price noise into a probabilistic edge—one that has helped countless traders navigate volatile markets for centuries.