Master Fibonacci Retracement Levels
Posted on
Start Trading
Posted at

Introduction to Fibonacci Retracement Levels
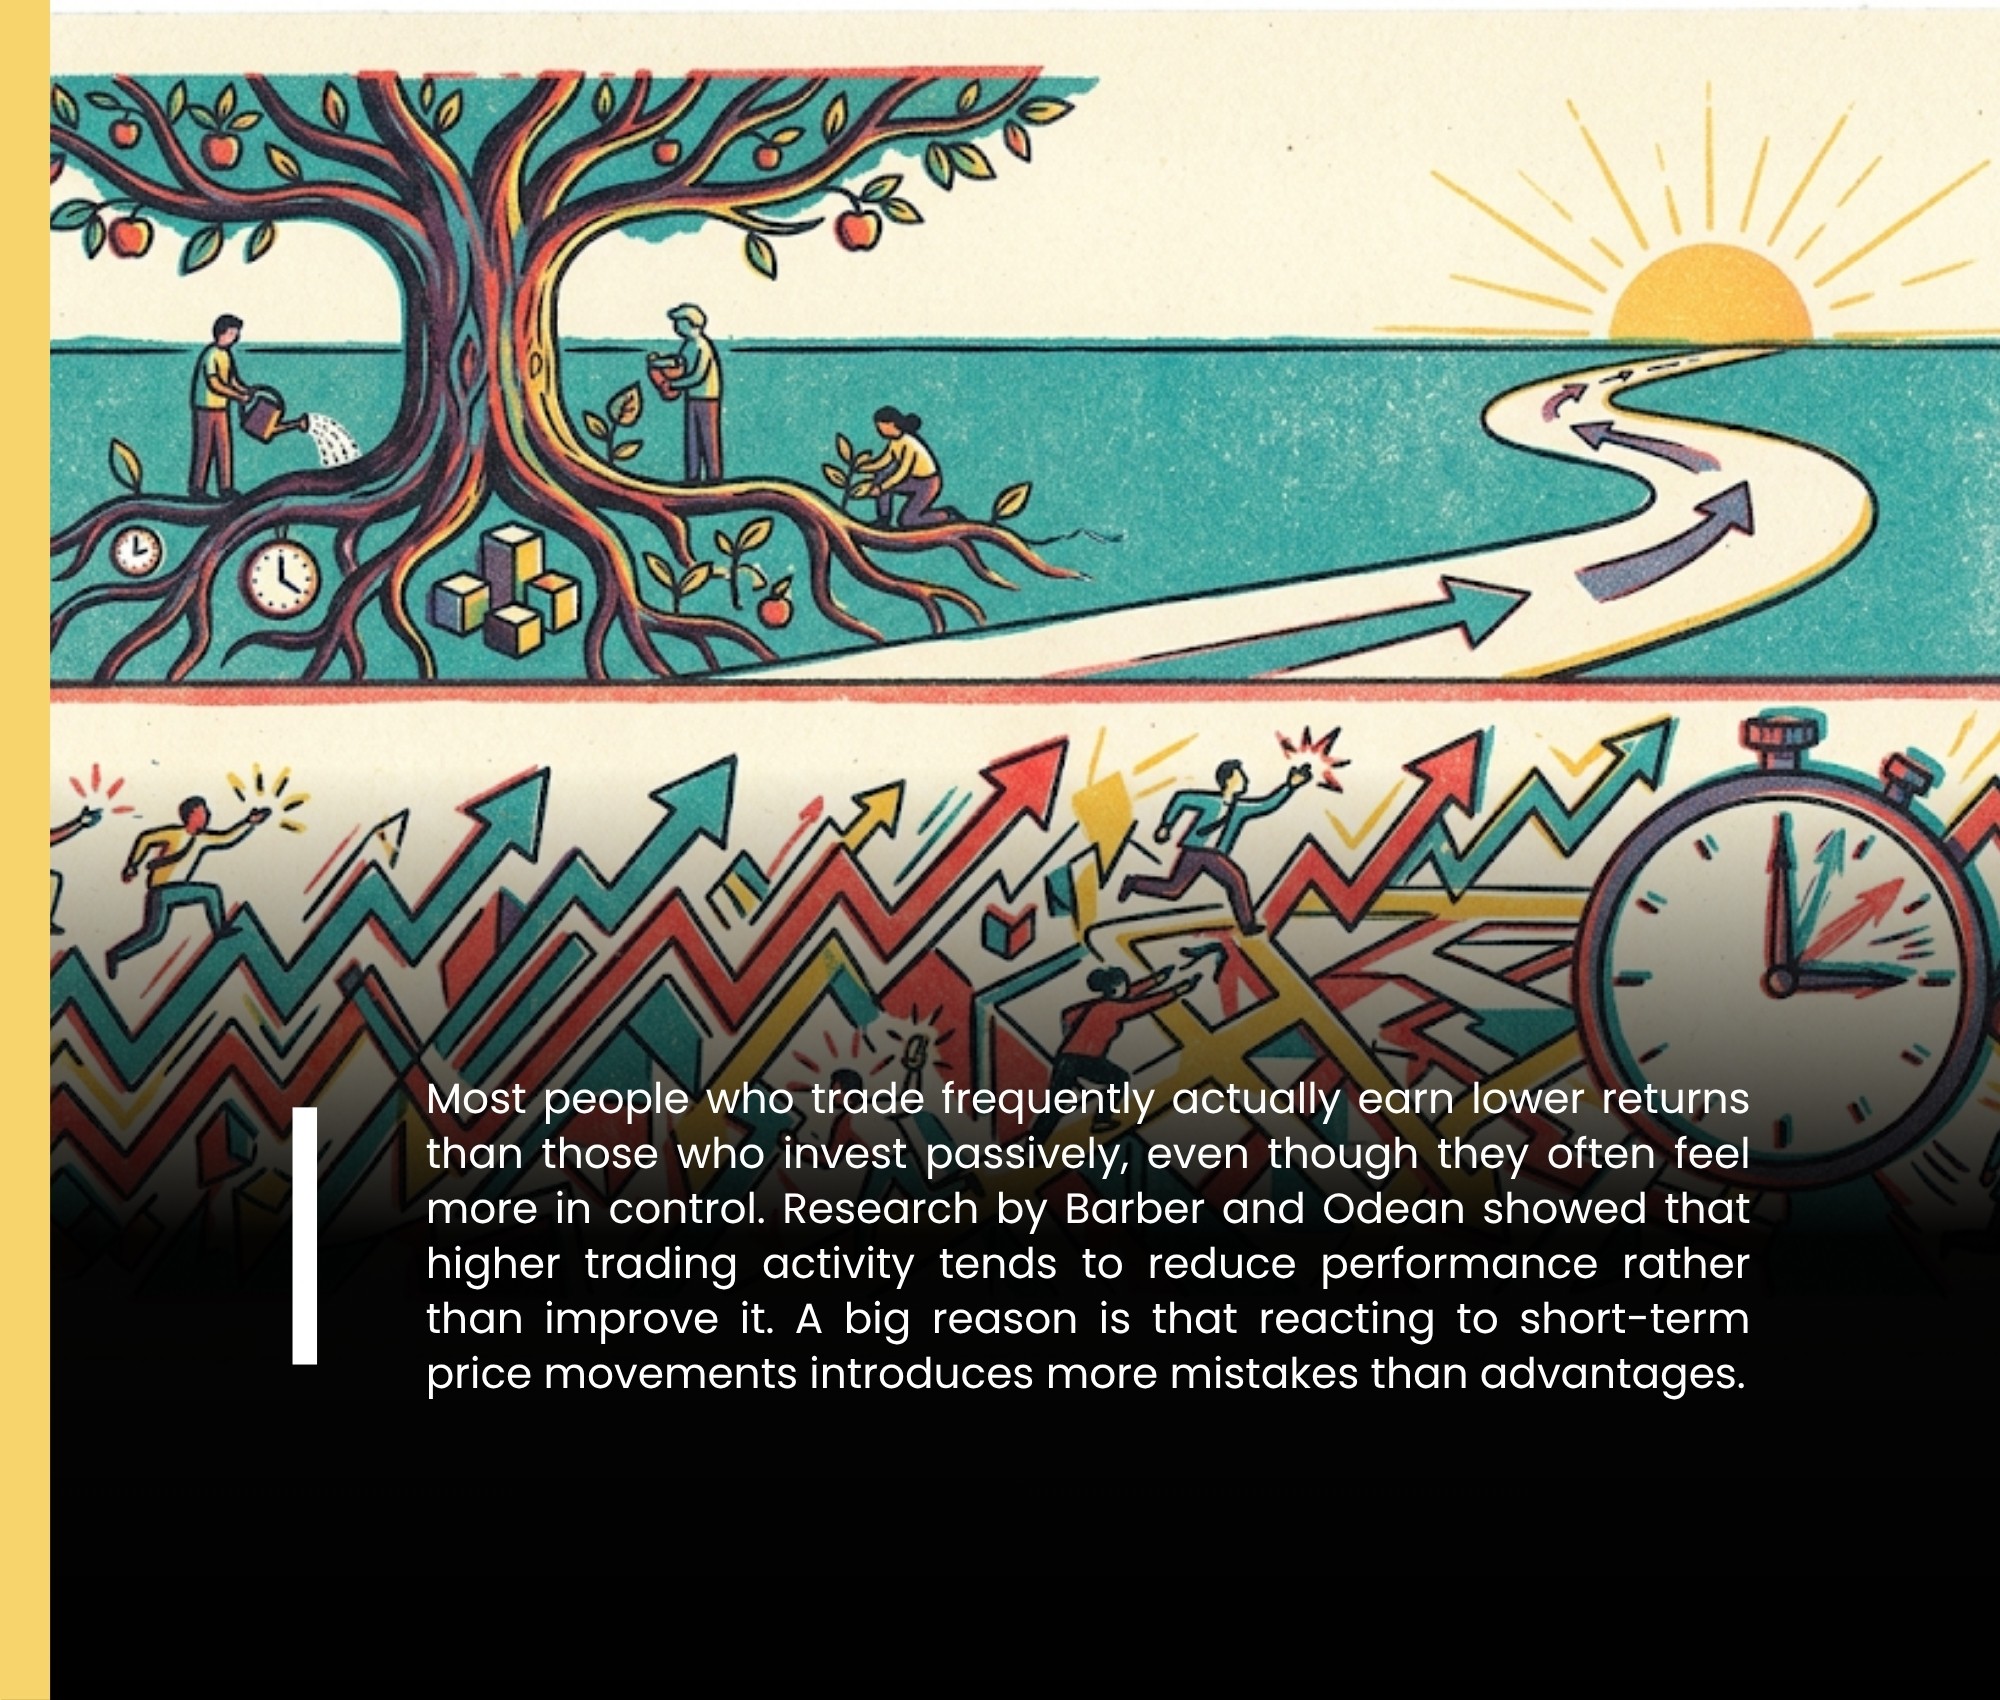
Fibonacci retracement levels represent one of the most respected technical analysis tools available to retail and professional investors today. These horizontal price lines help traders anticipate where a trending asset might pause, reverse, or continue after a significant move. Derived from the famous Fibonacci sequence, the levels highlight potential support during uptrends and resistance during downtrends, giving investors a mathematical framework for decision-making.
In volatile markets, where emotions often drive prices, Fibonacci retracement levels offer objectivity. They allow serious investors to map out logical zones for buying dips or selling rallies rather than guessing. Whether you trade blue-chip stocks, growth names, or ETFs, understanding Fibonacci retracement levels can sharpen your timing and improve risk-adjusted returns.
This guide breaks down the concept completely. You will learn the origins, precise calculation methods, practical charting techniques, advanced combination strategies, and critical risks. By the end, you will possess actionable insights to incorporate Fibonacci retracement levels into your own trading plan. For additional stock screening tools and market updates, visit other articles from the StockProfitClub
Many traders discover Fibonacci retracement levels after years of trial and error with moving averages or basic trendlines. The beauty lies in their universality. These levels appear across time frames, from intraday charts to weekly views, and across asset classes including equities, forex, commodities, and cryptocurrencies.
Investors who master Fibonacci retracement levels often report higher confidence in their setups. The tool does not predict the future with certainty, yet it provides high-probability zones where price action tends to react. When combined with volume confirmation or candlestick patterns, the edge becomes even stronger.
The Mathematical Foundation and History of Fibonacci
The story begins in 13th-century Italy with Leonardo of Pisa, known as Fibonacci. In his book Liber Abaci, he introduced the sequence 0, 1, 1, 2, 3, 5, 8, 13, 21, 34, 55, and so on, where each number equals the sum of the two preceding ones. Centuries later, traders noticed that ratios within this sequence appear repeatedly in nature, architecture, and financial markets.
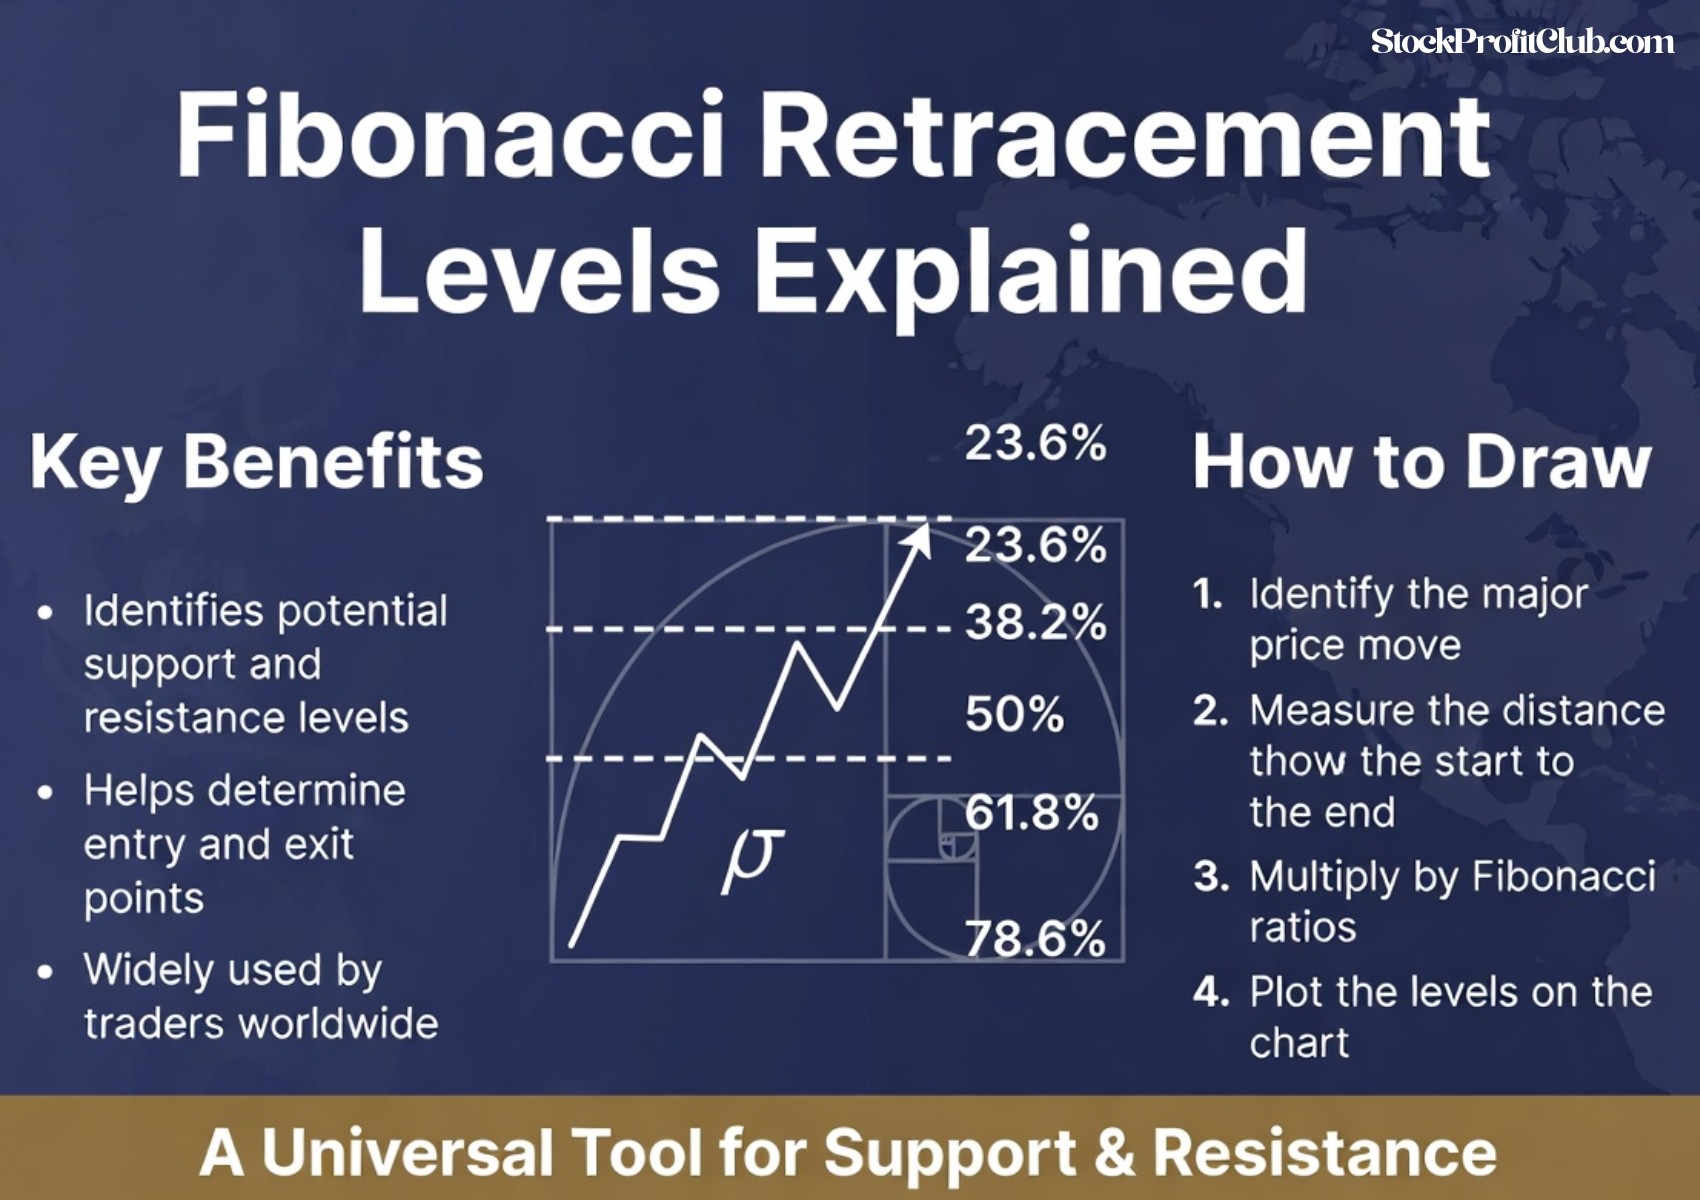
The golden ratio, approximately 1.618, sits at the heart of Fibonacci retracement levels. Key derivations include 0.618 (inverse of 1.618), 0.382 (1 minus 0.618), 0.236 (0.382 times 0.618), and 0.786 (square root of 0.618). Markets respect these proportions because human psychology, driven by fear and greed, creates self-fulfilling patterns around them.
Traders in the early 20th century, including Ralph Nelson Elliott of Elliott Wave Theory, popularized the application to price charts. Today, every major charting platform, from TradingView to Thinkorswim, includes built-in Fibonacci retracement tools.
Here are the standard Fibonacci retracement levels used by serious investors:
Level | Ratio | Typical Market Behavior | Strength |
|---|---|---|---|
0% | 0.000 | Recent swing high (uptrend) or low (downtrend) | Starting point |
23.6% | 0.236 | Shallow pullback, strong trend continuation likely | Weak |
38.2% | 0.382 | Moderate correction, common in healthy trends | Moderate |
50% | 0.500 | Psychological midpoint, not a true Fibonacci ratio but widely watched | Moderate |
61.8% | 0.618 | Golden ratio level, powerful support or resistance | Strong |
78.6% | 0.786 | Deep retracement, often signals major reversal | Very Strong |
100% | 1.000 | Original swing low (uptrend) or high (downtrend) | Ending point |
These percentages form the core of Fibonacci retracement levels analysis. Note that 50 percent, while not derived directly from the sequence, gained popularity because it represents a balanced halfway point that many algorithms and institutions respect.
The mathematics works identically in rising and falling markets. In an uptrend, measure from swing low to swing high, then project the retracement levels downward. In a downtrend, measure from swing high to swing low, then project upward. The resulting grid reveals where buyers or sellers are likely to defend price.
Fibonacci retracement levels gain extra power at confluence zones, where a level overlaps with a previous pivot high or low, a round number, or a moving average. When multiple signals align, the probability of a reaction increases significantly.
For live examples of how these levels perform on major stocks, check real-time charts on Yahoo Finance. Many professional fund managers reference Fibonacci retracement levels in their quarterly letters, confirming institutional adoption.
The history and math explain why Fibonacci retracement levels endure. They tap into universal proportions that govern crowd behavior in financial markets.
Step-by-Step Guide to Calculating and Applying Fibonacci
Applying Fibonacci retracement levels correctly requires discipline and accurate swing point selection. Follow these steps every time.
First, identify a clear trend. Look for a strong directional move with higher highs and higher lows (uptrend) or lower highs and lower lows (downtrend). Avoid choppy, range-bound periods where Fibonacci retracement levels lose reliability.
Second, select the swing points. In an uptrend, click the most recent significant low, then drag to the most recent significant high. Most platforms automatically calculate and plot the levels.
Third, read the price values. The software displays exact dollar amounts for each percentage. These become your watch levels.
Fourth, monitor price action as it approaches each level. Watch for rejection candles, increased volume, or divergence on momentum indicators.
Here is a practical example using hypothetical but realistic numbers. Assume Stock XYZ rallies from a swing low of $100 to a swing high of $200, a clean $100 move.
Calculation table:
Fibonacci Level | Ratio | Retracement Amount | Target Price | Interpretation |
|---|---|---|---|---|
23.6% | 0.236 | $23.60 | $176.40 | Minor support, trend likely resumes |
38.2% | 0.382 | $38.20 | $161.80 | Common healthy pullback |
50% | 0.500 | $50.00 | $150.00 | Psychological battle zone |
61.8% | 0.618 | $61.80 | $138.20 | Strong golden-ratio support |
78.6% | 0.786 | $78.60 | $121.40 | Deep support, reversal risk high |
Traders would place buy orders near $138.20 with a stop below $121.40, targeting a retest of $200 or higher. This setup offers an attractive risk-reward profile.
To validate, always zoom out to higher time frames. A daily 61.8 percent level that also aligns with the weekly 38.2 percent creates powerful confluence.
Platforms make drawing Fibonacci retracement levels effortless, yet the real skill lies in choosing the correct swings. Beginners often pick minor wiggles instead of major pivots. Practice on historical charts until the process becomes intuitive.
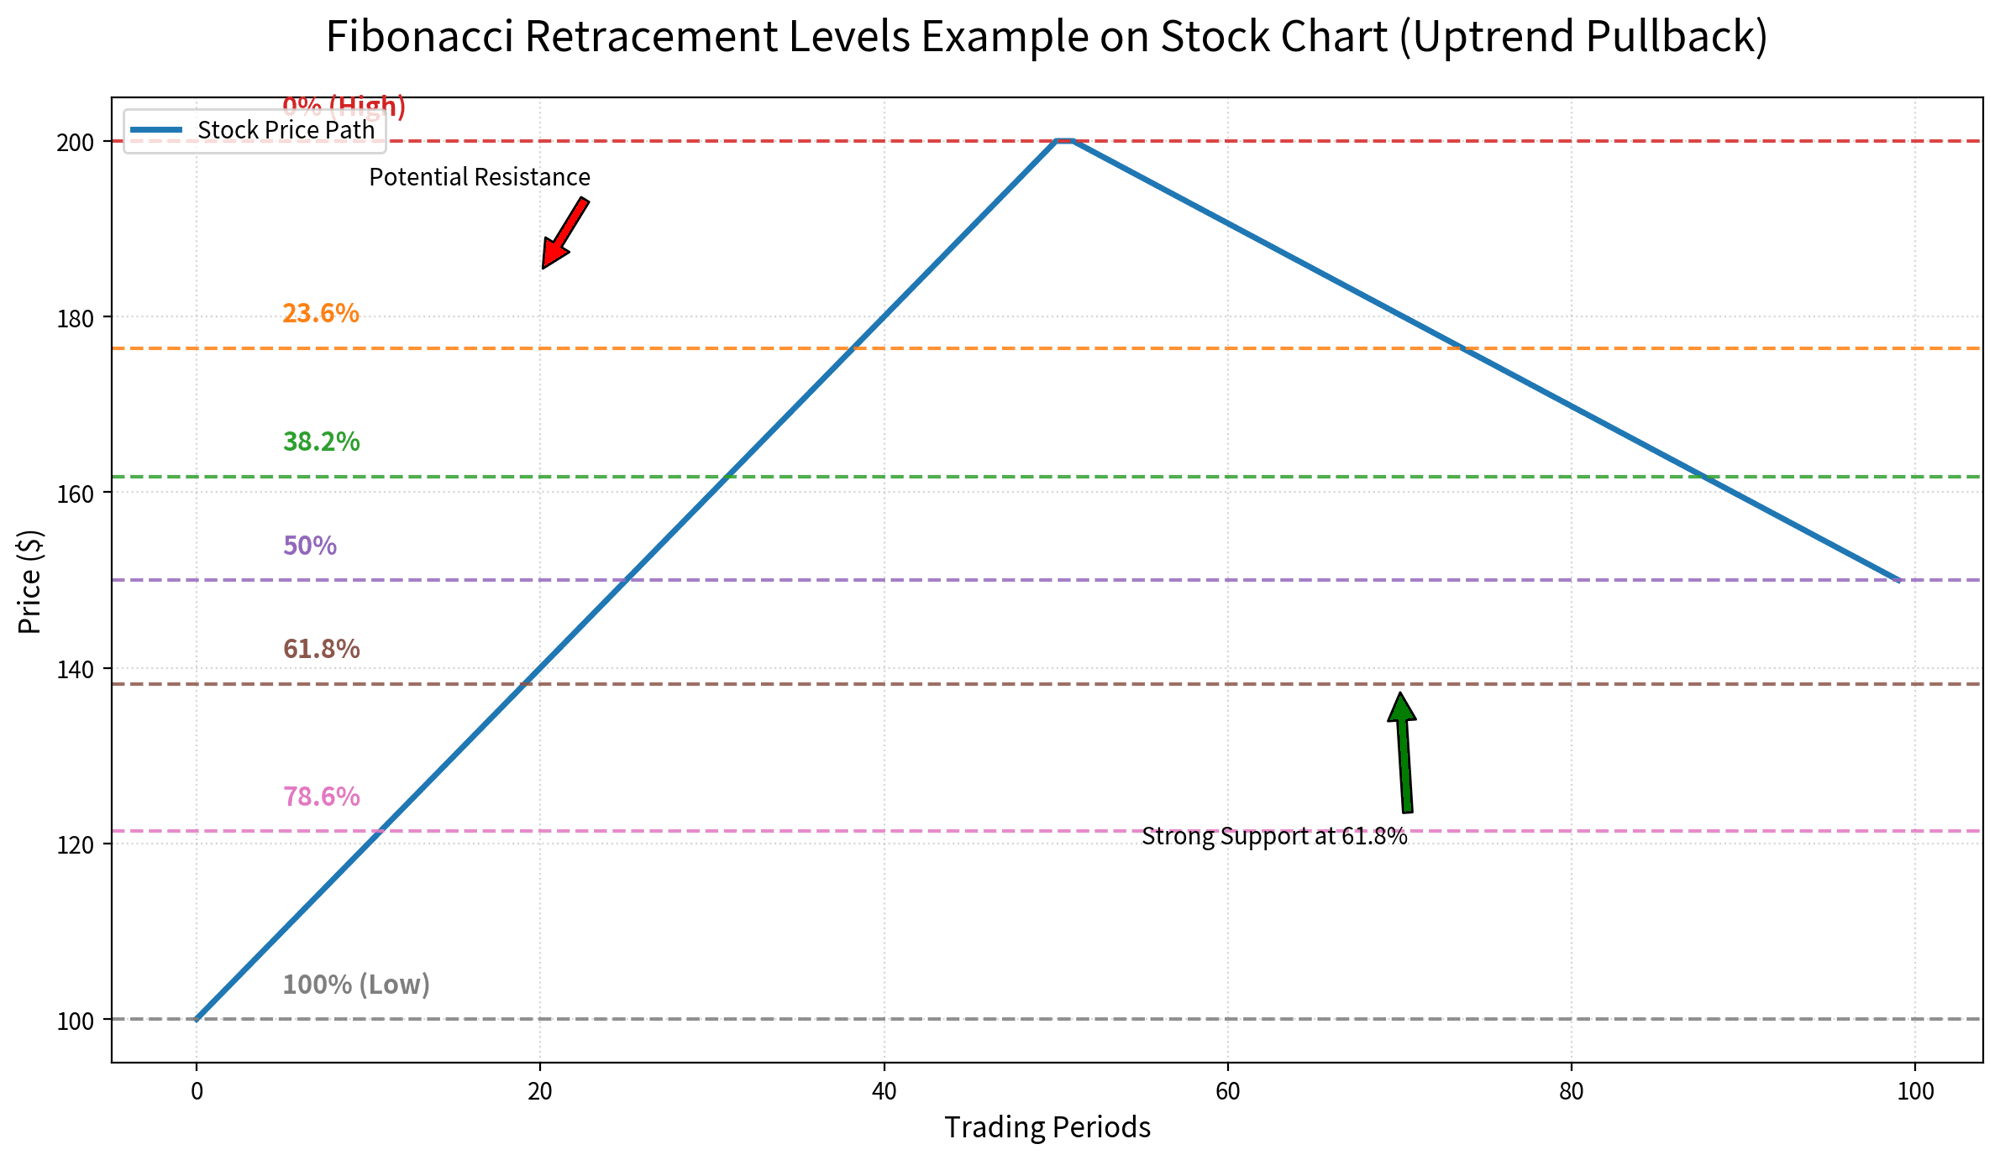
The example chart above, generated for educational purposes, illustrates how price respected the 61.8 percent level during a pullback before resuming the uptrend. Notice the strong bounce and subsequent new highs.
Trading Strategies Using Fibonacci
Once comfortable with basics, layer additional tools to elevate performance. Professional traders rarely use Fibonacci retracement levels in isolation.
One powerful approach combines them with moving averages. When price pulls back to the 61.8 percent Fibonacci retracement levels and simultaneously touches the 50-day simple moving average, the setup gains conviction.
Another tactic uses Fibonacci extensions for profit targets. After a retracement holds, project extensions at 127.2 percent, 161.8 percent, and 261.8 percent beyond the original swing. These levels often mark precise exhaustion points.
Volume profile adds confirmation. Heavy volume nodes near a Fibonacci level indicate institutional interest and higher probability of reversal.
In options trading, Fibonacci retracement levels help select strike prices. A call buyer might target the 161.8 percent extension for upside, while placing protective puts below the 78.6 percent retracement.
Cryptocurrency traders apply Fibonacci retracement levels aggressively because of higher volatility. Bitcoin’s major moves frequently respect the 61.8 percent level to the penny.
Case study style insight: During the 2023-2025 bull market in technology stocks, many names pulled back precisely to their 50 percent or 61.8 percent Fibonacci retracement levels before launching the next leg higher. Investors who bought those zones with tight stops captured outsized gains while limiting downside.
Risk-reward valuation table using Fibonacci retracement levels (example long setup):
Entry Level | Stop Loss | Target (161.8% ext.) | Risk Amount | Reward Amount | Risk/Reward Ratio |
|---|---|---|---|---|---|
61.8% retrace | Below 78.6% | $250 from $200 high | $18 | $62 | 1:3.4 |
50% retrace | Below 61.8% | $240 | $12 | $52 | 1:4.3 |
38.2% retrace | Below 50% | $230 | $8 | $42 | 1:5.25 |
Adjust position size according to the ratio. Aim for at least 1:3 to maintain positive expectancy over many trades.
Combine with RSI. When price reaches a Fibonacci retracement levels and RSI shows oversold divergence below 30, the probability of bounce rises sharply.
Takeaways for Fibonacci Retracement Levels
No tool is perfect. Fibonacci retracement levels can produce false signals, especially in strong trending markets that barely retrace or during major news events that override technical levels.
Common pitfalls include:
Selecting incorrect swing points that ignore the dominant trend structure
Trading every level without waiting for confirmation candles or volume
Ignoring the broader market context, such as sector rotation or macroeconomic shifts
Overleveraging because a level “looks perfect”
Applying the tool in sideways, low-volume ranges where levels have little meaning
Risk table:
Risk | Description | Mitigation Strategy |
|---|---|---|
False breakout | Price pierces level briefly then reverses | Require closing candle confirmation |
News override | Earnings or Fed announcements ignore levels | Avoid trading 24 hours before/after high-impact events |
Wrong time frame | Daily levels ignored on hourly chart | Align multiple time frames for confluence |
Over-reliance | Treating levels as guaranteed rather than probable | Always combine with minimum two other indicators |
Psychological bias | Forcing trades at favorite levels | Maintain a pre-defined trading plan and journal |
Serious investors mitigate these risks by using Fibonacci retracement levels as one piece of a larger puzzle. Never risk more than 1 percent of portfolio capital on any single setup based solely on Fibonacci retracement levels.
Strategic investor takeaway: Treat Fibonacci retracement levels as a high-probability map rather than a crystal ball. When price respects a key level with volume and momentum confirmation, act decisively. When it does not, move on without emotion. Over time, this disciplined approach compounds into superior performance compared to discretionary guessing.
Backtest your Fibonacci retracement levels setups on at least 100 historical trades. Track win rate, average winner, average loser, and maximum drawdown. Refine until expectancy turns clearly positive.
The markets will always offer new opportunities. Fibonacci retracement levels give you a timeless edge that has worked for generations and will continue to work because human nature does not change.