The 9 Most Costly Technical Analysis Mistakes Beginners Make (And How to Fix Them)
Posted on
Start Trading
Posted at

What Is Technical Analysis, and Why Do Beginners Get It Wrong?
Technical analysis is the practice of evaluating securities by studying historical price movements, trading volume, and chart patterns to forecast future price behavior. Unlike fundamental analysis, which examines a company's financial health, technical analysis focuses entirely on market action itself, operating on the premise that price reflects all available information.
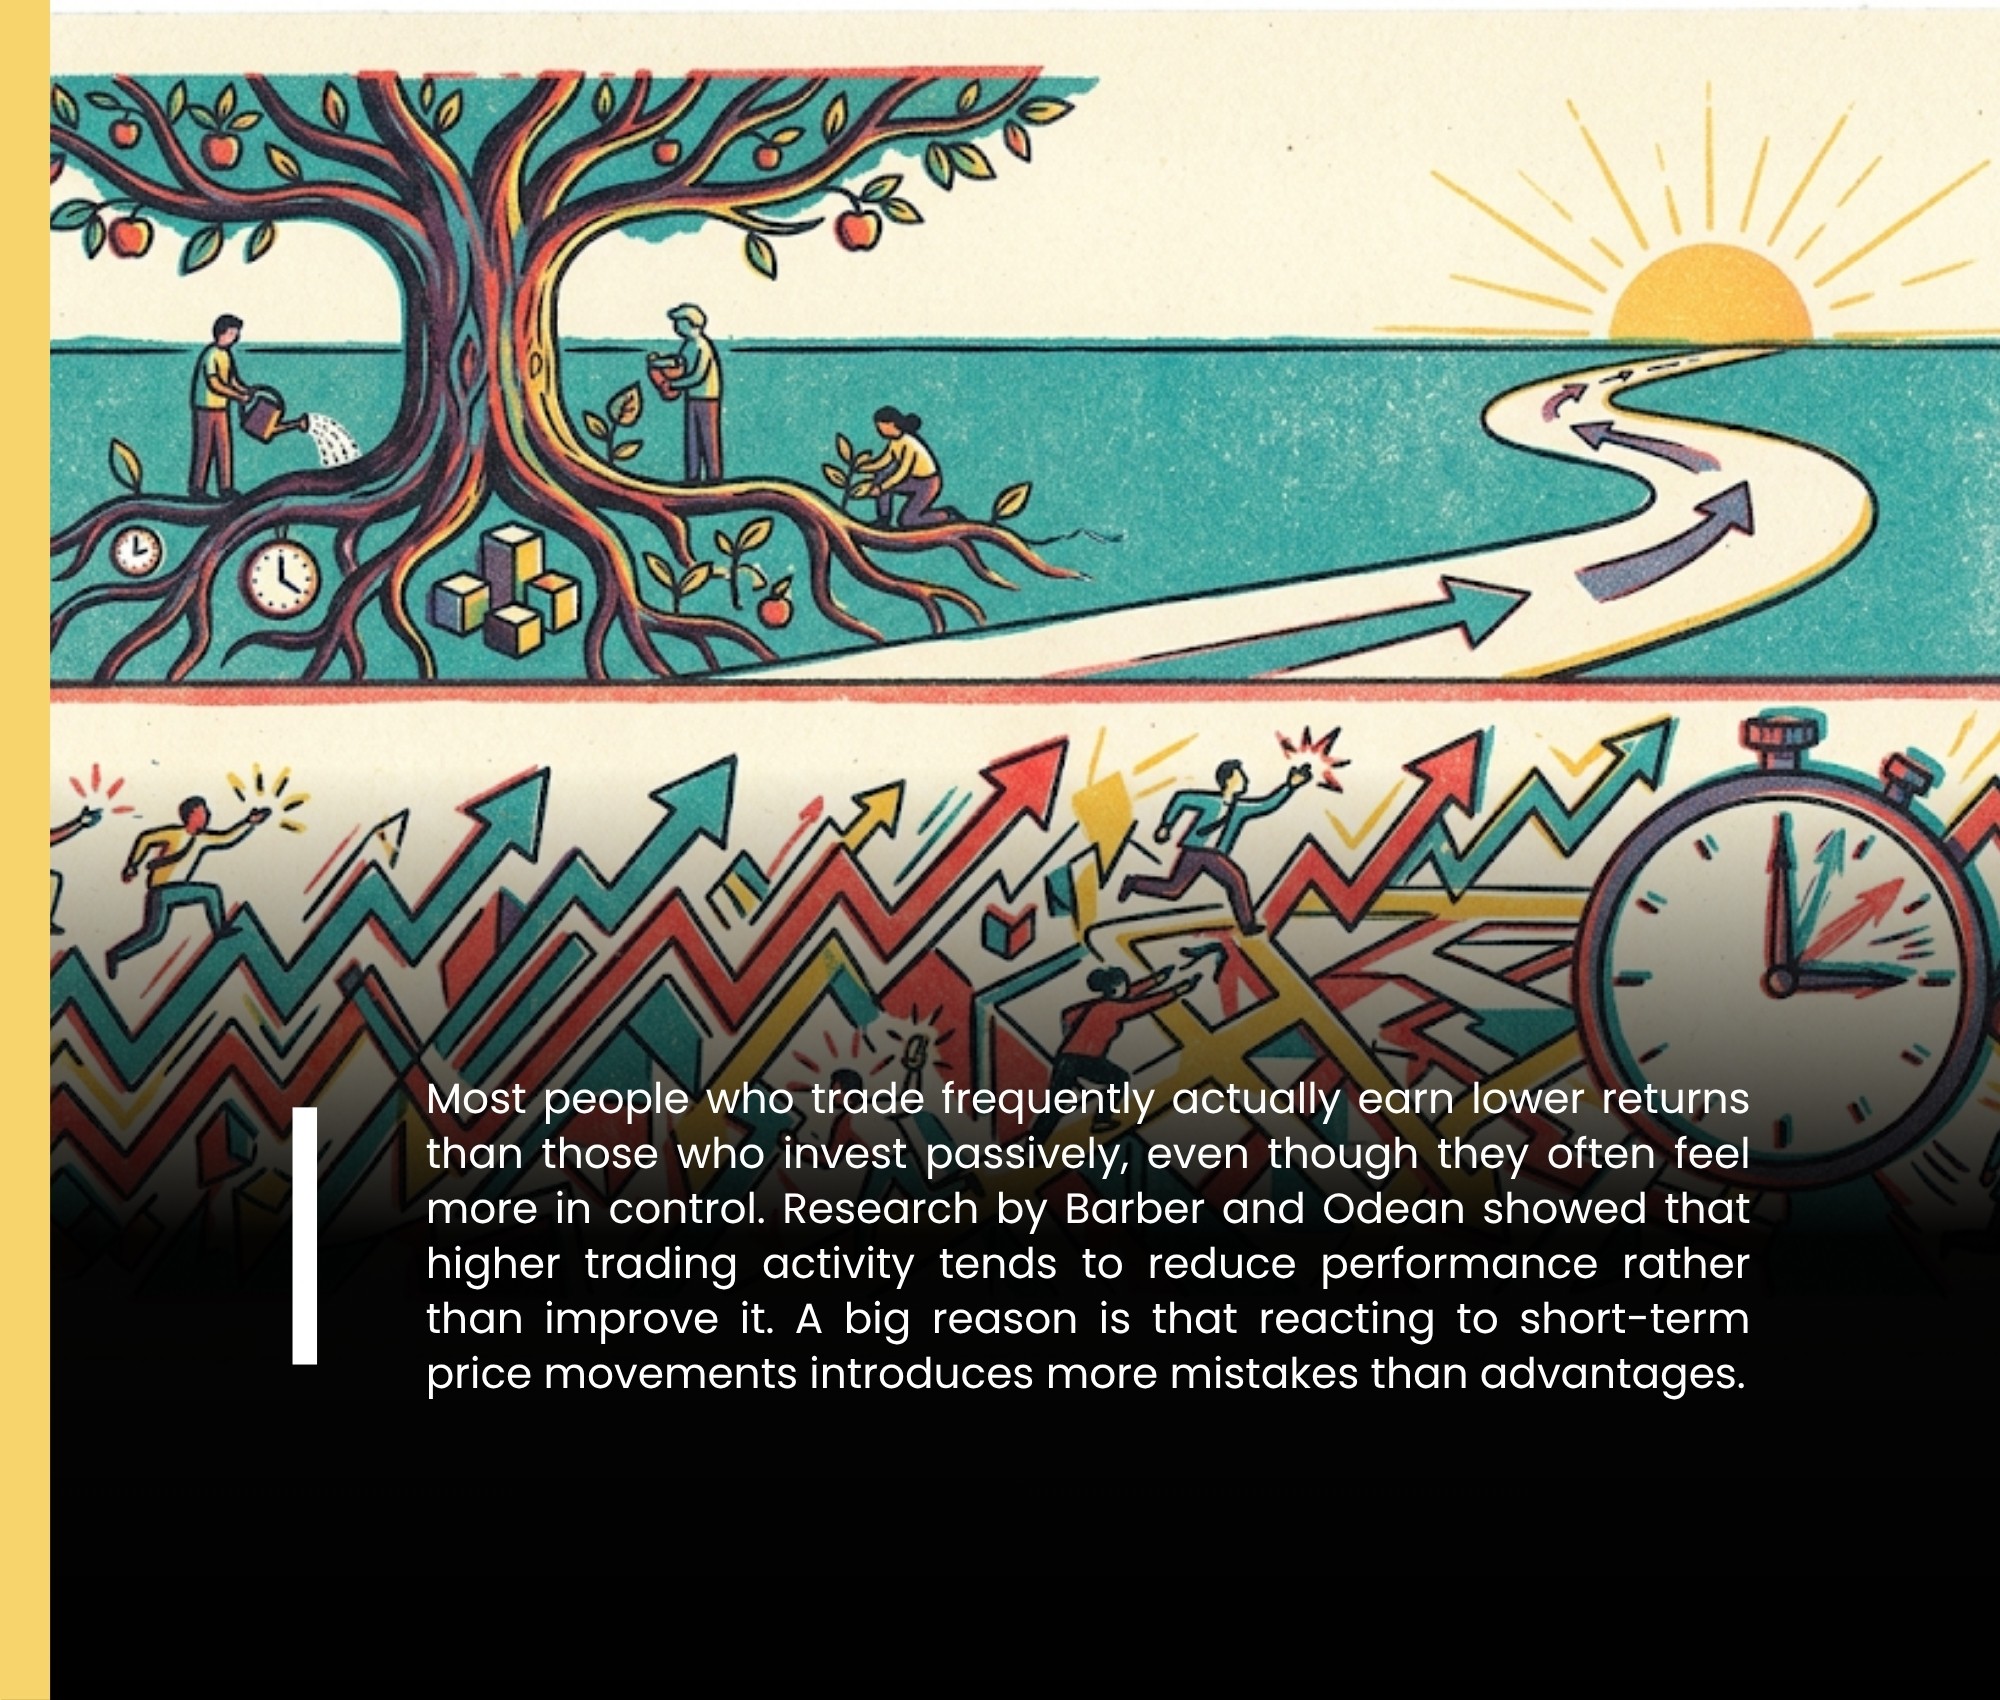
For beginners, this discipline appears deceptively simple. Charts are visual, indicators are plentiful, and the internet offers an endless supply of "winning setups." Yet the majority of new traders fail within their first year, and a significant portion of those failures trace back to the same recurring technical analysis mistakes beginners make over and over.
This article identifies the nine most damaging errors, explains precisely why they happen, and provides actionable corrections. Whether you are just opening your first brokerage account or refining a strategy that has not yet produced consistent results, these insights will help you build a more disciplined and profitable approach to reading the markets.
Key Definition
Technical Analysis is a trading discipline that uses price charts, volume data, and mathematical indicators to identify patterns and probabilities in market behavior. It is a tool for decision-making, not a guarantee of outcomes.
You can explore more foundational concepts, stock picks, and trading education at Stock Profit Club, where our team breaks down complex financial strategies into clear, actionable content for investors at every level.
Mistakes 1 Through 3: The Chart Reading Errors That Cost You Most
Mistake 1: Trading Without Confirming the Trend
The single most common technical analysis mistake beginners make is entering a trade without first establishing the direction of the dominant trend. A chart can look bullish on a 5-minute timeframe while simultaneously being in a powerful downtrend on the daily chart.
New traders pick setups that look clean on one timeframe and ignore the broader context entirely. They end up buying into countertrend bounces, mistaking temporary relief rallies for genuine reversals. The trade fails not because the setup was bad in isolation, but because it was pointing in the wrong direction relative to the dominant force in the market.
The fix: Always establish trend direction on at least two higher timeframes before entering a position. A 15-minute trade should be validated against the hourly and daily chart. If the higher timeframes show a downtrend, only take short setups on the lower timeframe, never longs.
Mistake 2: Overloading Charts with Indicators
Open any beginner trading forum and you will see screenshots of charts buried under five or six overlapping indicators. RSI, MACD, Bollinger Bands, Stochastic, and three moving averages all stacked on a single price chart. The result is analysis paralysis and contradictory signals.
Indicators are derived from the same raw price and volume data. Stacking multiple momentum oscillators does not give you five independent data points. It gives you five versions of the same story, creating the illusion of confirmation where none actually exists.
The fix: Limit yourself to a maximum of two or three indicators, and ensure they serve different analytical functions. For example, one trend indicator (such as a 20-period EMA), one momentum indicator (RSI), and one volume indicator (OBV) cover three distinct dimensions of price behavior without redundancy.
Table 1: Common Indicators by Function Category
Indicator | Category | What It Measures | Best Used For |
|---|---|---|---|
Moving Average (EMA/SMA) | Trend | Average price over N periods | Identifying trend direction |
RSI (14) | Momentum | Speed and change of price moves | Overbought / oversold levels |
MACD | Momentum / Trend | Convergence of two EMAs | Trend changes and momentum shifts |
Bollinger Bands | Volatility | Price deviation from mean | Volatility contractions, squeezes |
OBV | Volume | Cumulative volume pressure | Confirming breakouts with volume |
Stochastic | Momentum | Close relative to recent range | Redundant if RSI is already used |
Mistake 3: Chasing Breakouts Without Volume Confirmation
A stock breaks above a key resistance level and the beginner rushes in, excited by the price action. Two candles later, the price reverses sharply and closes back below resistance. This is called a false breakout or a "fakeout," and it is one of the most expensive lessons in technical trading.
Price alone does not validate a breakout. Volume does. When a breakout occurs on meaningfully above-average volume (typically 1.5x to 2x the 20-day average), institutional participation is likely behind the move. When price breaks out on thin, light volume, the move is suspect and susceptible to reversal.
The fix: Never enter a breakout trade unless volume on the breakout candle is materially higher than the recent average. If volume is not confirming, wait for a retest of the broken level on lower volume, which provides a safer entry with a tighter stop.
"The market has a way of punishing those who act on price alone. Volume is the fuel that makes a breakout real."
Mistakes 4 Through 6: Risk Management and Psychological Traps
Mistake 4: Placing Stop-Losses in the Wrong Location
Beginners either skip stop-losses entirely (hoping a losing trade "comes back") or place them at arbitrary round numbers like $50.00 or $100.00 that have no structural significance on the chart. Both approaches lead to preventable and oversized losses.
A stop-loss should be placed at a level that technically invalidates your trade thesis, not at a level that limits your dollar loss by a fixed amount. If you bought a stock because it bounced off a support level, your stop belongs just below that support, because a close below it means the trade setup is no longer valid.
The fix: Define your invalidation point first (the level at which the trade is simply wrong), then size your position accordingly so the dollar risk stays within your predetermined risk-per-trade limit (commonly 1 to 2 percent of total capital).
Mistake 5: Ignoring Risk-to-Reward Ratios
Many beginners evaluate a trade purely by how likely it is to go their way. They rarely ask the more important question: how much do I make if I am right versus how much do I lose if I am wrong?
A trade that wins 60 percent of the time can still be a net money-loser if the average loss is three times larger than the average gain. Conversely, a strategy that wins only 40 percent of the time can be highly profitable if winners are consistently three times larger than losers.
Table 2: Risk-to-Reward Ratio Impact on Overall Profitability (100 trades)
Win Rate | Risk-to-Reward Ratio | Avg Win ($) | Avg Loss ($) | Net P&L (100 Trades) | Result |
|---|---|---|---|---|---|
60% | 1:1 | $100 | $100 | +$2,000 | Profitable |
60% | 1:0.5 | $50 | $100 | -$1,000 | Losing |
40% | 1:3 | $300 | $100 | +$6,000 | Profitable |
50% | 1:2 | $200 | $100 | +$5,000 | Profitable |
50% | 1:1 | $100 | $100 | $0 | Break Even |
The fix: Only take trades where the potential reward is at least 2 times the potential risk. A minimum 1:2 risk-to-reward ratio gives your strategy a sustainable mathematical edge, even when your win rate is below 50 percent.
Mistake 6: Letting Emotions Override the Chart
Fear and greed are the two forces that destroy otherwise sound technical setups. Fear causes traders to exit winning positions too early, cutting profits short. Greed causes them to hold losing positions too long, hoping for a reversal that never comes.
This is particularly acute for beginners because they have not yet built the experience to trust their analysis. They second-guess every signal and let real-time price swings manipulate their judgment rather than executing based on a pre-defined plan.
The fix: Build a written trading plan before the market opens. Define your entry, stop, and target in advance. Do not alter stop-losses in the direction of a losing trade once it is open. Discipline is not natural, it is a habit built through repetition and journaling.
Mistakes 7 Through 9: Pattern Misuse and Structural Blind Spots
Mistake 7: Forcing Chart Patterns That Are Not There
Pattern recognition is a core element of technical analysis, but the human brain is wired to find patterns even where none exist. Beginners frequently identify Head and Shoulders formations, Cup and Handle patterns, and ascending triangles that are vague, asymmetrical, or built on insufficient data.
A pattern that takes two weeks to form on a 1-minute chart carries far less predictive weight than the same pattern forming over four months on a weekly chart. Timeframe matters enormously, as does the number of touches confirming the key structural levels (support, resistance, necklines).
The fix: Require at least three confirmed touches on any trendline or structural level before treating it as significant. Be strict about pattern geometry. If you are unsure whether a pattern exists, it probably does not, at least not yet.
Mistake 8: Ignoring Support and Resistance on Higher Timeframes
A stock approaching a level that served as strong resistance for months is a completely different situation from a stock approaching a level that was only resistance for two days. Beginners often fail to zoom out and identify the major structural levels that professional traders are watching.
When a price level has been tested multiple times over a long period, it becomes what technicians call a "high-confluence zone." These zones attract large institutional orders and generate the most reliable technical reactions. Ignoring them is like navigating a highway without knowing where the on-ramps are.
The fix: Before trading any setup, mark the key support and resistance zones on the weekly and monthly charts first. Then work down to the daily and intraday. Know where the large players have historically reacted. Trade with those levels, not against them.
Table 3: Risk Profile by Trade Scenario (Example: $10,000 Account)
Scenario | Entry Price | Stop Level | Target | Position Size | Max Loss | Max Gain | R:R |
|---|---|---|---|---|---|---|---|
Stop at round number | $52.00 | $50.00 | $58.00 | 50 shares | -$100 | +$300 | 1:3 |
Stop below support | $52.00 | $51.20 | $55.60 | 125 shares | -$100 | +$450 | 1:4.5 |
No stop (emotional exit) | $52.00 | None | $58.00 | 200 shares | -$1,400+ | +$1,200 | Negative |
Proper 1% risk rule | $52.00 | $51.50 | $53.50 | 200 shares | -$100 | +$300 | 1:3 |
Mistake 9: Neglecting the Role of Catalysts and Market Context
Technical analysis does not exist in a vacuum. A textbook-perfect bullish flag pattern forming ahead of a Federal Reserve interest rate announcement can break down violently the moment the news hits. Beginners often treat technical setups as self-contained, forgetting that macro forces, earnings reports, sector rotations, and geopolitical events can override any pattern.
This does not mean you need to be a macro economist to use technical analysis. It means you need a basic awareness of when major scheduled events are occurring and how they might impact your trades. Holding a leveraged position through a major earnings event without knowing the date is not bold, it is uninformed.
The fix: Check the economic calendar every week. Know when your stock's earnings report is due. Be aware of major Fed meetings and economic data releases. Either reduce your position size ahead of these events or step aside entirely until the volatility resolves.
For regular updates on market-moving catalysts, macro themes, and sector analysis, visit Stock Profit Club, where we track the events that matter most to active investors and swing traders.
Build Your Edge, Remove Your Errors
Technical analysis is not a crystal ball, and it was never meant to be. It is a probabilistic framework that, when applied with discipline and structural understanding, gives traders a measurable edge over time. The mistakes covered in this article are not exotic or obscure. They are the predictable, recurring errors that separate consistently profitable traders from those who cycle through account after account without ever understanding why.
The good news is that every mistake outlined here has a clear, actionable correction. None of them require advanced mathematics or years of study to address. They require honesty, structure, and the willingness to build habits that override emotional impulses.
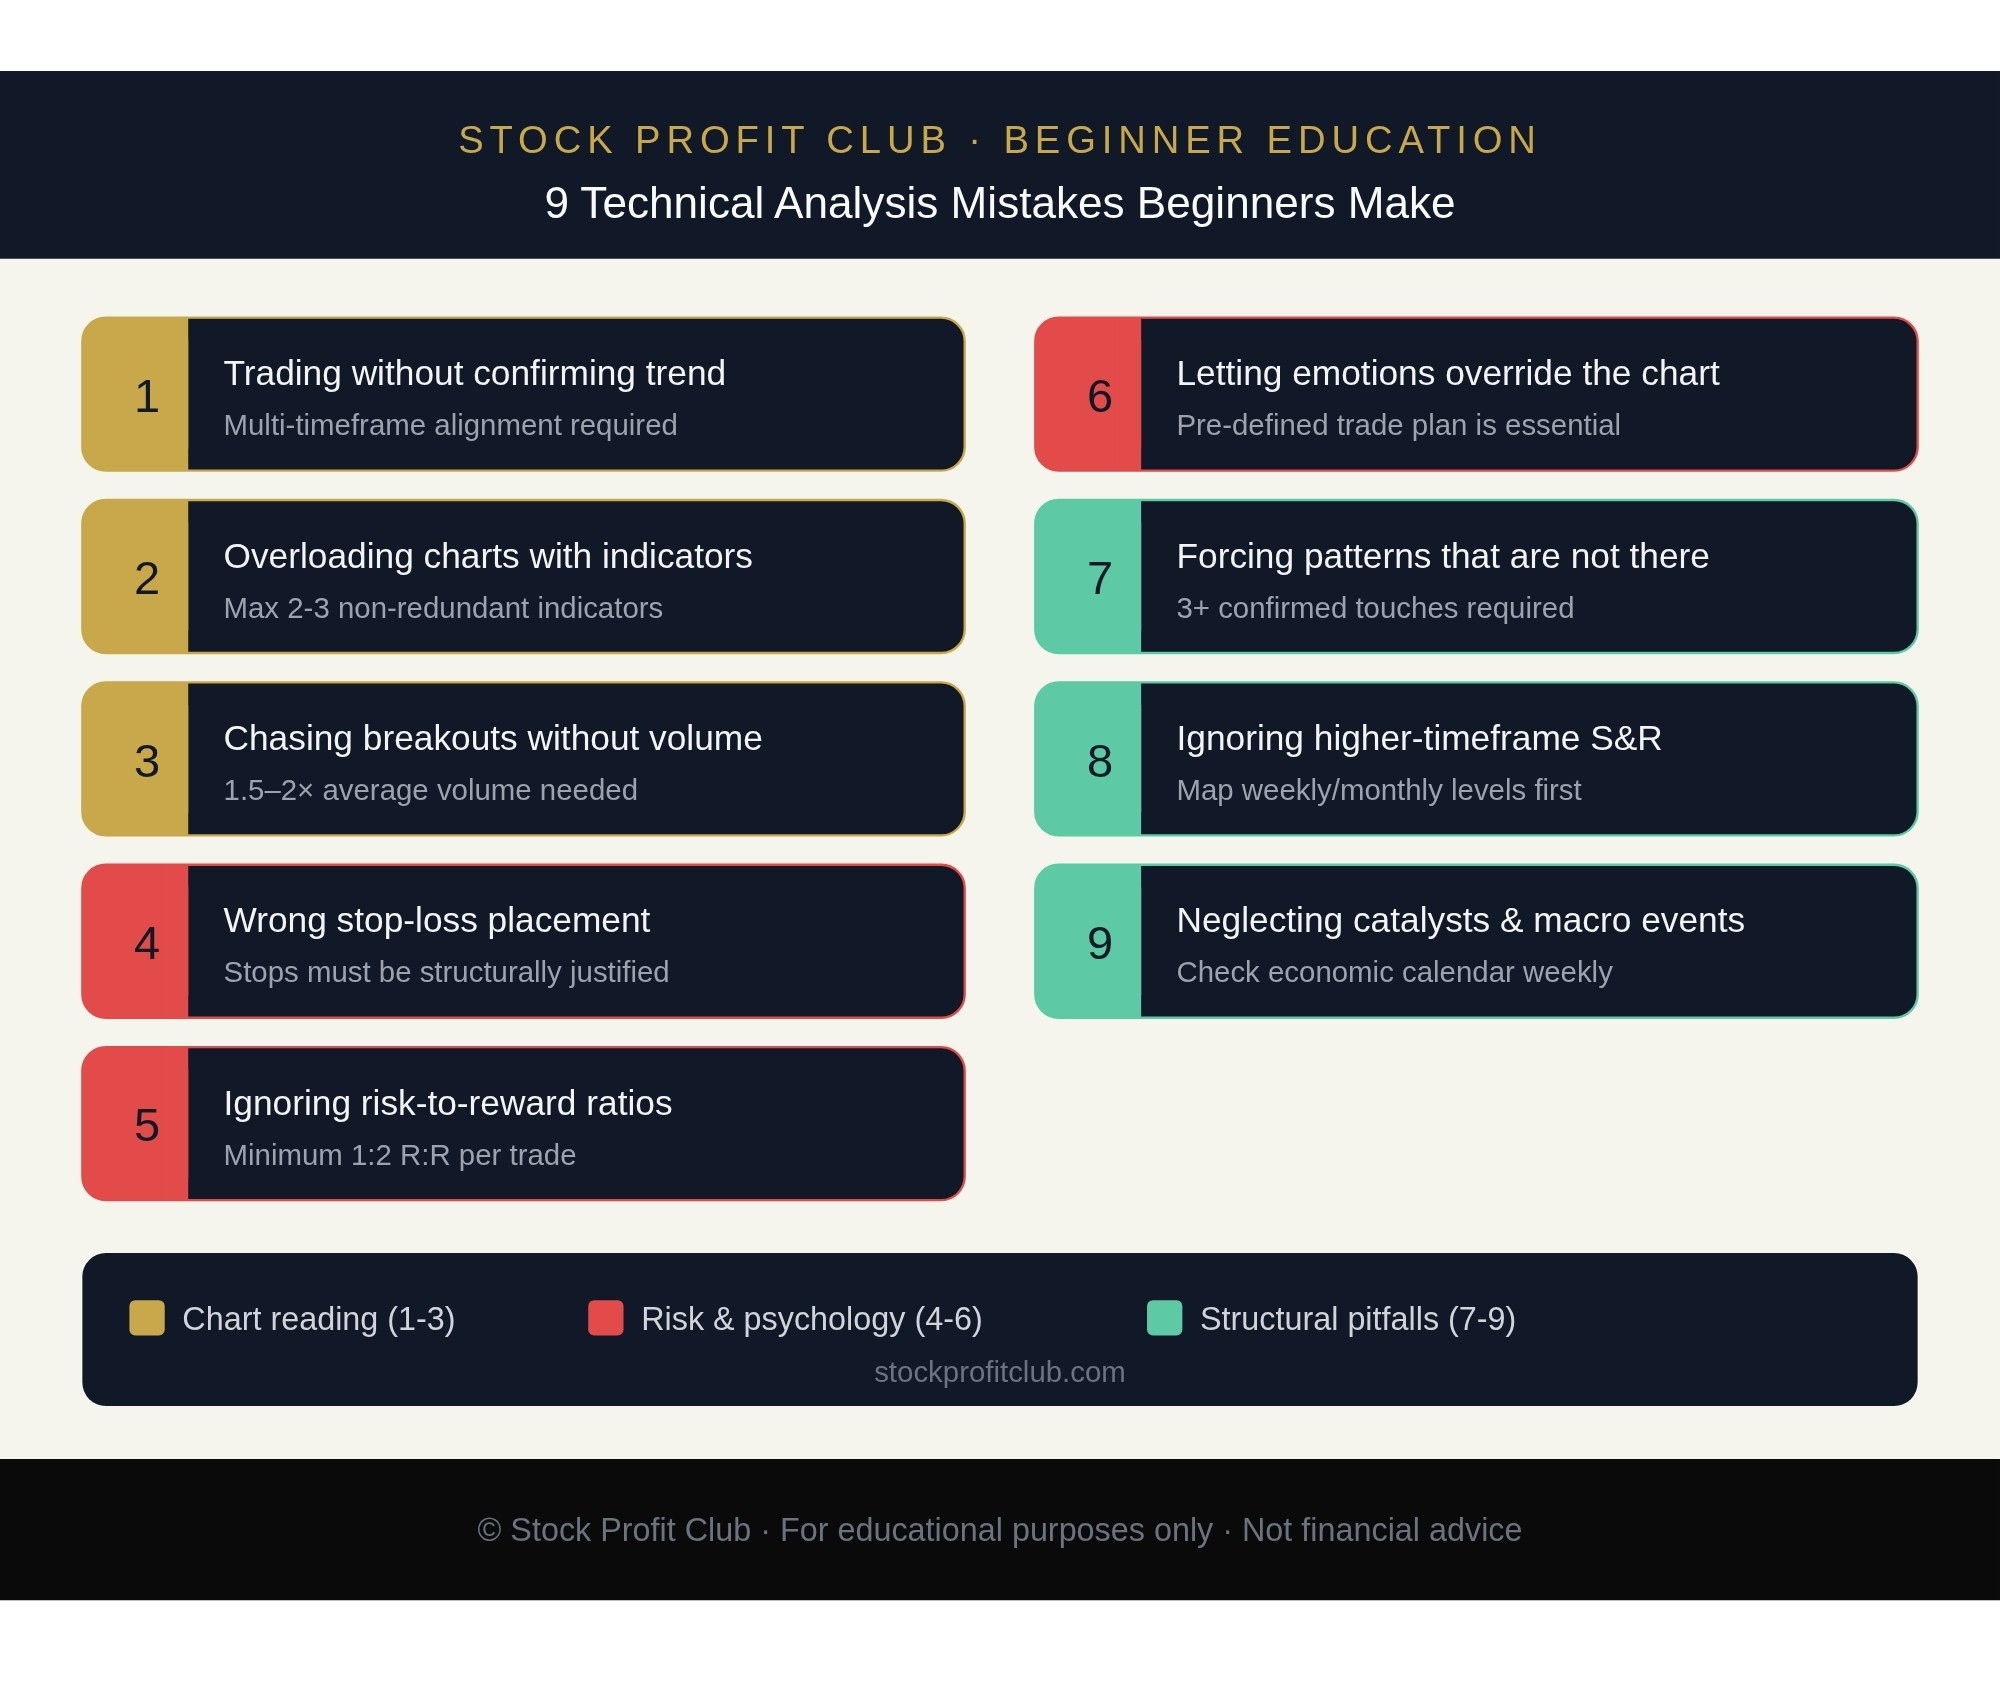
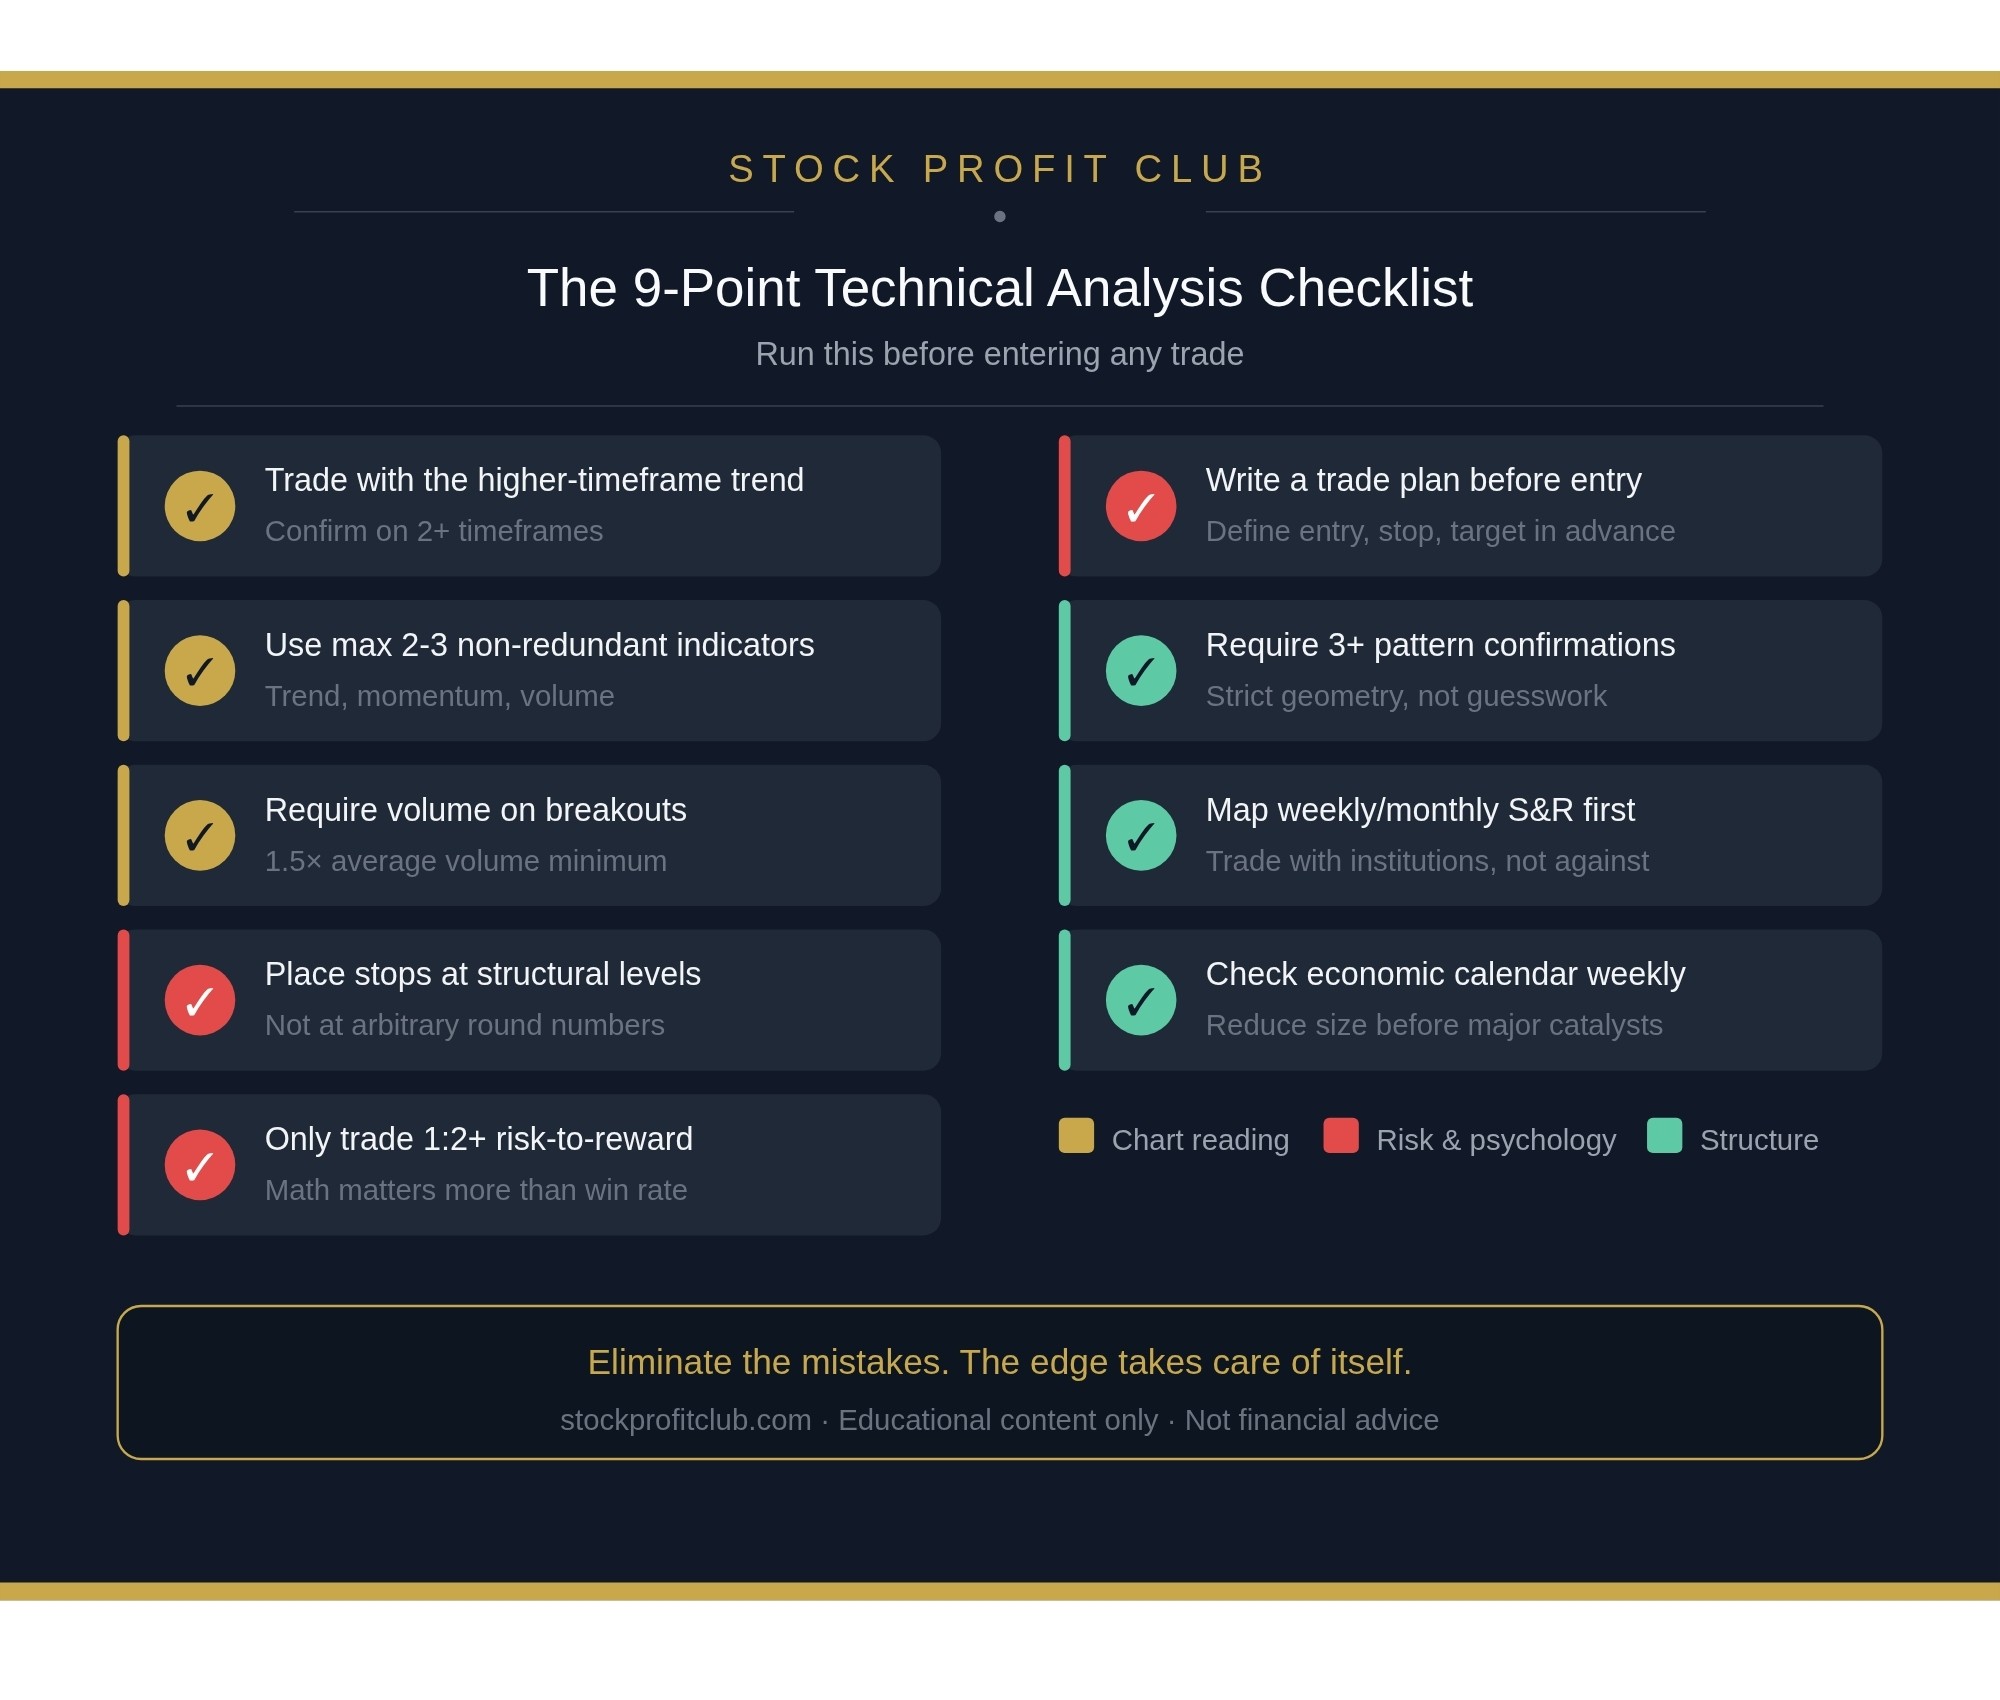
Here is a concise summary of the corrective framework every beginner should internalize:
Always trade in the direction of the higher-timeframe trend.
Use no more than two or three non-redundant indicators per chart.
Require volume confirmation before entering any breakout trade.
Place stops at technically significant levels, not arbitrary price points.
Only take trades with a minimum 1:2 risk-to-reward ratio.
Build a written trade plan and execute it without emotional interference.
Apply strict criteria to chart patterns, requiring multiple confirmed touches.
Mark major support and resistance on higher timeframes before lower ones.
Stay aware of scheduled macro and company-level catalysts before entering positions.
Eliminating these nine technical analysis mistakes beginners commonly make will not turn you into a perfect trader overnight, but it will dramatically reduce the unnecessary losses that derail most new participants before they ever develop a real edge.
"The best traders do not predict the market. They respond to it, with rules, patience, and precision. Remove the mistakes, and the edge takes care of itself."
Mastery in technical analysis is not about finding a secret indicator or a magic pattern. It is about eliminating the cognitive and procedural errors that make your results random. Once your process is sound, consistency follows naturally.
Continue developing your trading knowledge with the in-depth analysis, stock strategies, and market breakdowns available at Stock Profit Club, your destination for serious, research-backed investment content.