How to Use Volume and Candlesticks for Winning Swing Trades
Posted on
Start Trading
Posted at

Why Volume and Candlesticks Are the Swing Trader's Edge
Most retail traders lose money in the market not because they lack intelligence, but because they read price in isolation. They look at a chart, spot a pattern, and enter a trade, only to find that the market reverses against them the moment they commit capital. What they are missing is context, and in swing trading, the most powerful context comes from two sources: volume and candlestick structure.
Swing trading, broadly defined, is a medium-term strategy that aims to capture price moves lasting anywhere from two days to several weeks. Unlike day trading, which demands constant screen attention, swing trading allows investors to hold positions across multiple sessions while targeting meaningful price dislocations. The challenge is identifying which moves are real and which are traps.
This is precisely where swing trading with volume and candlesticks becomes transformative. When you combine the visual language of candlesticks, which encode open, close, high, and low within a single bar, with volume, which measures the number of shares or contracts traded during that period, you gain a two-dimensional view of market behavior. One dimension tells you what happened to price. The other tells you how much conviction stood behind that move.
"Price tells you where the market went. Volume tells you whether the market believed it."
In this guide, you will learn the mechanics of both tools, how institutional traders use volume to reveal their positions, which candlestick patterns carry the highest probability when confirmed by volume, how to build a complete trade setup from signal to exit, and how to manage risk using a structured framework.
By the end, you will have a repeatable process for identifying high-quality swing trade opportunities, the kind that the Stock Profit Club community uses to find actionable setups week after week.
Reading Volume Like an Institutional Trader
Volume is the most underappreciated indicator in retail trading. It sits at the bottom of most charting platforms, small and often overlooked, yet it contains information that no price indicator can replicate. Volume tells you who is in control of a move and whether that move has the fuel to continue.
The Three Volume Conditions Every Swing Trader Must Know
Before analyzing patterns, you need to understand the baseline. Volume is always relative, relative to the stock's own history and to its average. A useful benchmark is the 20-day average volume (ADV). Any session trading above 1.5x ADV is considered elevated and deserves your full attention.
The three core volume conditions are:
Expansion (above 1.5x ADV): A large participant, typically a mutual fund, hedge fund, or algorithmic system, is entering or exiting a significant position. This kind of volume rarely appears without purpose.
Contraction (below 0.7x ADV): The market is resting. Neither buyers nor sellers are pressing. This is where the best setups consolidate before the next directional move.
Neutral (0.7x to 1.5x ADV): Normal session activity. Price movement on neutral volume should be treated with skepticism, as it lacks the institutional backing needed to sustain a swing move.
Volume Spread Analysis: Decoding Intent
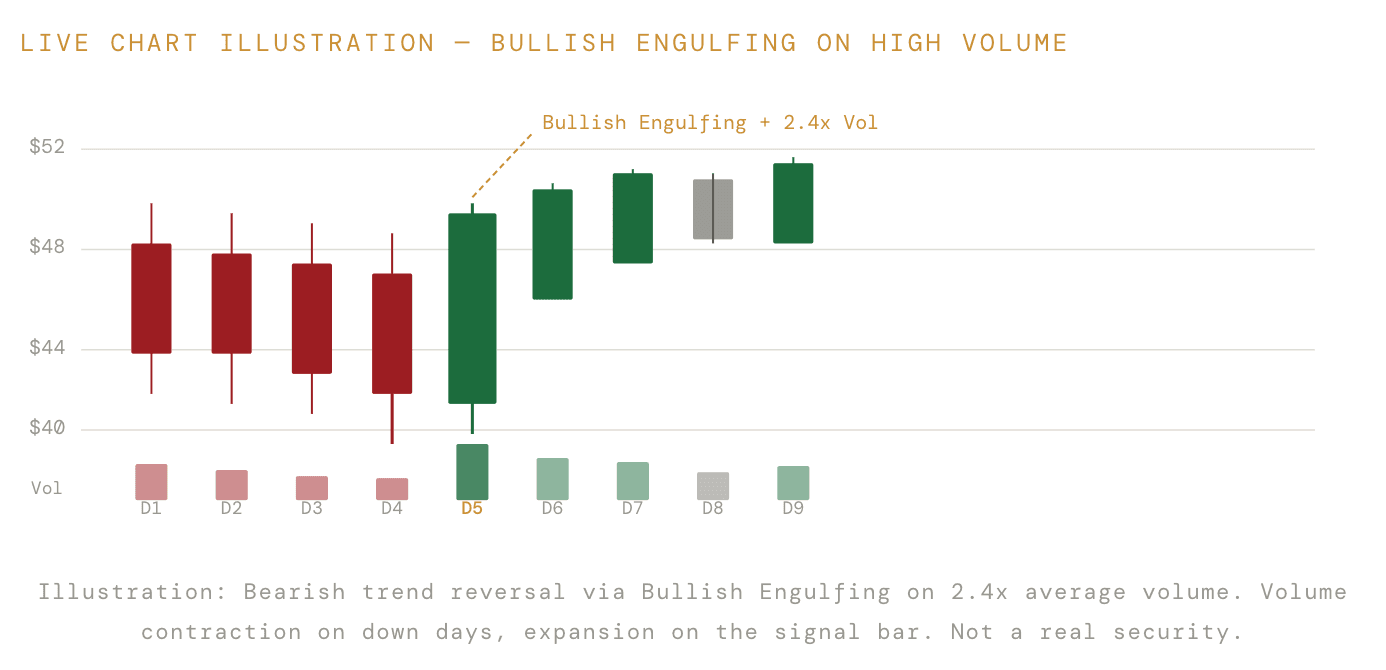
Volume Spread Analysis (VSA) pairs the size of the candlestick body and wick with the session's volume to infer institutional intent. The core insight is that wide price spread on high volume reflects genuine commitment, while narrow price spread on high volume reveals a tug-of-war where supply is absorbing demand, or vice versa.
The most critical signal in VSA for swing traders is Climactic Action: a very wide-range bar on the highest volume in weeks or months. If this bar closes in the middle or lower third of its range on a sell-off, it signals potential capitulation by sellers and a possible reversal higher. The same logic applies in reverse at tops.
Table 1 — Volume Signals and Their Interpretations
Volume Signal | Candlestick Character | Interpretation | Bias |
|---|---|---|---|
High volume (2x+ ADV), wide up bar closing near high | Strong bullish body, small upper wick | Institutional buying, demand in control |
|
High volume (2x+ ADV), wide bar closing in middle | Long wicks both sides, small body | Supply absorbing demand (No Demand signal) |
|
High volume, narrow body down bar near support | Long lower wick, small red body | Selling climax, buyers stepping in at lows |
|
Low volume, narrow up bar in downtrend | Small green body, minimal wicks | No demand, weak bounce, do not buy |
|
Low volume, tight range consolidation | Several small-bodied candles, wicks contained | Equilibrium, coiling before breakout |
|
Rising price, declining volume over 3-5 sessions | Progressively smaller bullish bodies | Effort-result divergence, move losing momentum |
|
The On-Balance Volume (OBV) Divergence Strategy
On-Balance Volume accumulates volume on up days and subtracts it on down days, producing a running total that tracks institutional positioning. When OBV makes new highs while price is still below a prior resistance level, it means institutional buyers are accumulating quietly, often the best pre-breakout signal available to retail traders.
Look for OBV to diverge before price confirms. The institutional hand is revealed in OBV weeks before the price chart shows it clearly.
High-Probability Candlestick Patterns for Swing Trades
Candlestick analysis originated in 18th-century Japan with rice trader Munehisa Homma, who recognized that markets are driven not only by supply and demand but by the psychology of traders. Each candle captures four psychological data points: the opening sentiment, the closing conviction, the maximum optimism (high), and the maximum fear (low) of a given session.
For swing traders, not all patterns are equal. Single-candle patterns have lower reliability than two or three-candle formations. And any pattern, regardless of how textbook-perfect it appears, carries limited probability unless confirmed by volume. Below are the six patterns with the strongest risk-reward profile for swing trading with volume and candlesticks.
The Six Patterns That Matter Most
Table 2 — Candlestick Patterns for Swing Trading: Characteristics and Volume Requirements
Pattern | Type | Structure | Volume Requirement | Win Rate (est.) |
|---|---|---|---|---|
Hammer |
| Small body, long lower wick (2x body), minimal upper wick | At or above ADV, ideally 1.5x+ | ~58% |
Bullish Engulfing |
| Green body fully engulfs prior red body | Higher than prior session, 1.5x+ ADV preferred | ~63% |
Morning Star |
| 3-bar: strong down, small doji, strong up | Doji session low volume, third bar high volume | ~67% |
Shooting Star |
| Small body, long upper wick (2x body) at resistance | At or above ADV | ~55% |
Bearish Engulfing |
| Red body fully engulfs prior green body | Higher than prior session, 1.5x+ ADV | ~61% |
Evening Star |
| 3-bar: strong up, small doji, strong down | Doji session low volume, third bar high volume | ~65% |
Win rate estimates above are based on backtested frequency data across liquid large-cap and mid-cap equities in trending market conditions. Real-world results depend on entry precision, stop placement, and overall market environment. Always confirm patterns with at least one additional confluence factor.
Key Principle: Pattern Without Volume Is Noise
A textbook Bullish Engulfing on below-average volume should be ignored. Institutional participation is what drives swing moves. Without the volume confirmation, a pattern is merely a visual artifact with no predictive power. Always check the volume bar before acting on any candlestick signal.
Building a Complete Swing Trade Setup, From Signal to Exit
Identifying a candlestick pattern on elevated volume is the beginning of a process, not the decision itself. Professional swing traders use a structured framework that layers multiple confluences to achieve a high-probability entry and a clearly defined exit. The framework below is the same logic practiced by experienced members of the Stock Profit Club community.
Step 1: Establish Market Structure
Begin on the weekly chart. Identify the dominant trend. In an uptrend, you are looking for pullbacks to support, where buyers historically stepped in. In a downtrend, you are looking for rallies to resistance as shorting opportunities. Trading against the primary trend with swing strategies dramatically reduces win rate.
Drop to the daily chart and identify the nearest meaningful support and resistance levels. These become your reference points for entry and target placement.
Step 2: Volume Context Check
Before entering any trade, run through these three volume questions:
Is the stock's recent volume expanding (trend phase) or contracting (consolidation)?
Has OBV been making higher highs in alignment with price, or is there divergence?
Is the current session's volume trending above the ADV as the signal forms?
All three should align with your intended direction. Two out of three is acceptable. One out of three is a pass.
Step 3: Candlestick Signal at a Key Level
The candlestick signal is your trigger. It needs to form at a meaningful level: a prior swing low, a multi-week moving average (the 21-day or 50-day EMA), a Fibonacci retracement (38.2%, 50%, or 61.8%), or a major round number. A pattern in the middle of nowhere carries far less weight than one that aligns with a key structural level.
Step 4: Entry, Stop, and Target
For bullish setups: enter on the open of the session after the signal candle confirms, or use a buy-stop order one tick above the signal candle's high. Place your stop-loss one tick below the signal candle's low. This defines your risk with precision.
Your primary target is the next significant resistance level on the daily chart. A minimum reward-to-risk ratio of 2:1 should be your threshold. Below 2:1, the setup does not justify the risk capital.
Step 5: Position Sizing
Risk no more than 1% to 2% of your total account on any single swing trade. Calculate position size by dividing your dollar risk (account size x risk percentage) by the per-share risk (entry price minus stop price). This is the single most important rule separating traders who survive long-term from those who do not.
Risk/Reward Framework — Example Scenarios
Setup Quality | Entry | Stop Loss | Target 1 | Target 2 | R:R Ratio | Position Size (1% risk, $50k account) |
|---|---|---|---|---|---|---|
A-Grade (3+ confluences) | $42.00 | $40.50 | $45.00 | $47.50 | 2:1 / 3.7:1 | 333 shares |
B-Grade (2 confluences) | $38.00 | $36.80 | $40.40 | $42.00 | 2:1 / 3.3:1 | 416 shares |
C-Grade (1 confluence) | Pass. Does not meet minimum threshold for entry. | |||||
Risk Management, Common Mistakes, and the Strategic Takeaway
The best candlestick setup with perfect volume confirmation will still lose if risk management is absent. Trading is a probabilistic endeavor, and no strategy wins 100% of the time. The goal is to lose small when wrong and win large when right, so that over a sufficient sample of trades, the account equity curve trends upward even with a win rate of only 50% to 55%.
The Five Most Damaging Swing Trading Mistakes
Chasing entries: Entering after the signal candle has moved significantly removes your favorable risk-reward ratio. If you missed the setup, let it go.
Ignoring the broader market: Even the best individual stock setup can fail in a declining S&P 500. Always check whether the market environment supports your directional bias.
Moving the stop loss: Once placed, the stop is non-negotiable. Moving it wider is capitulating to emotion, not strategy.
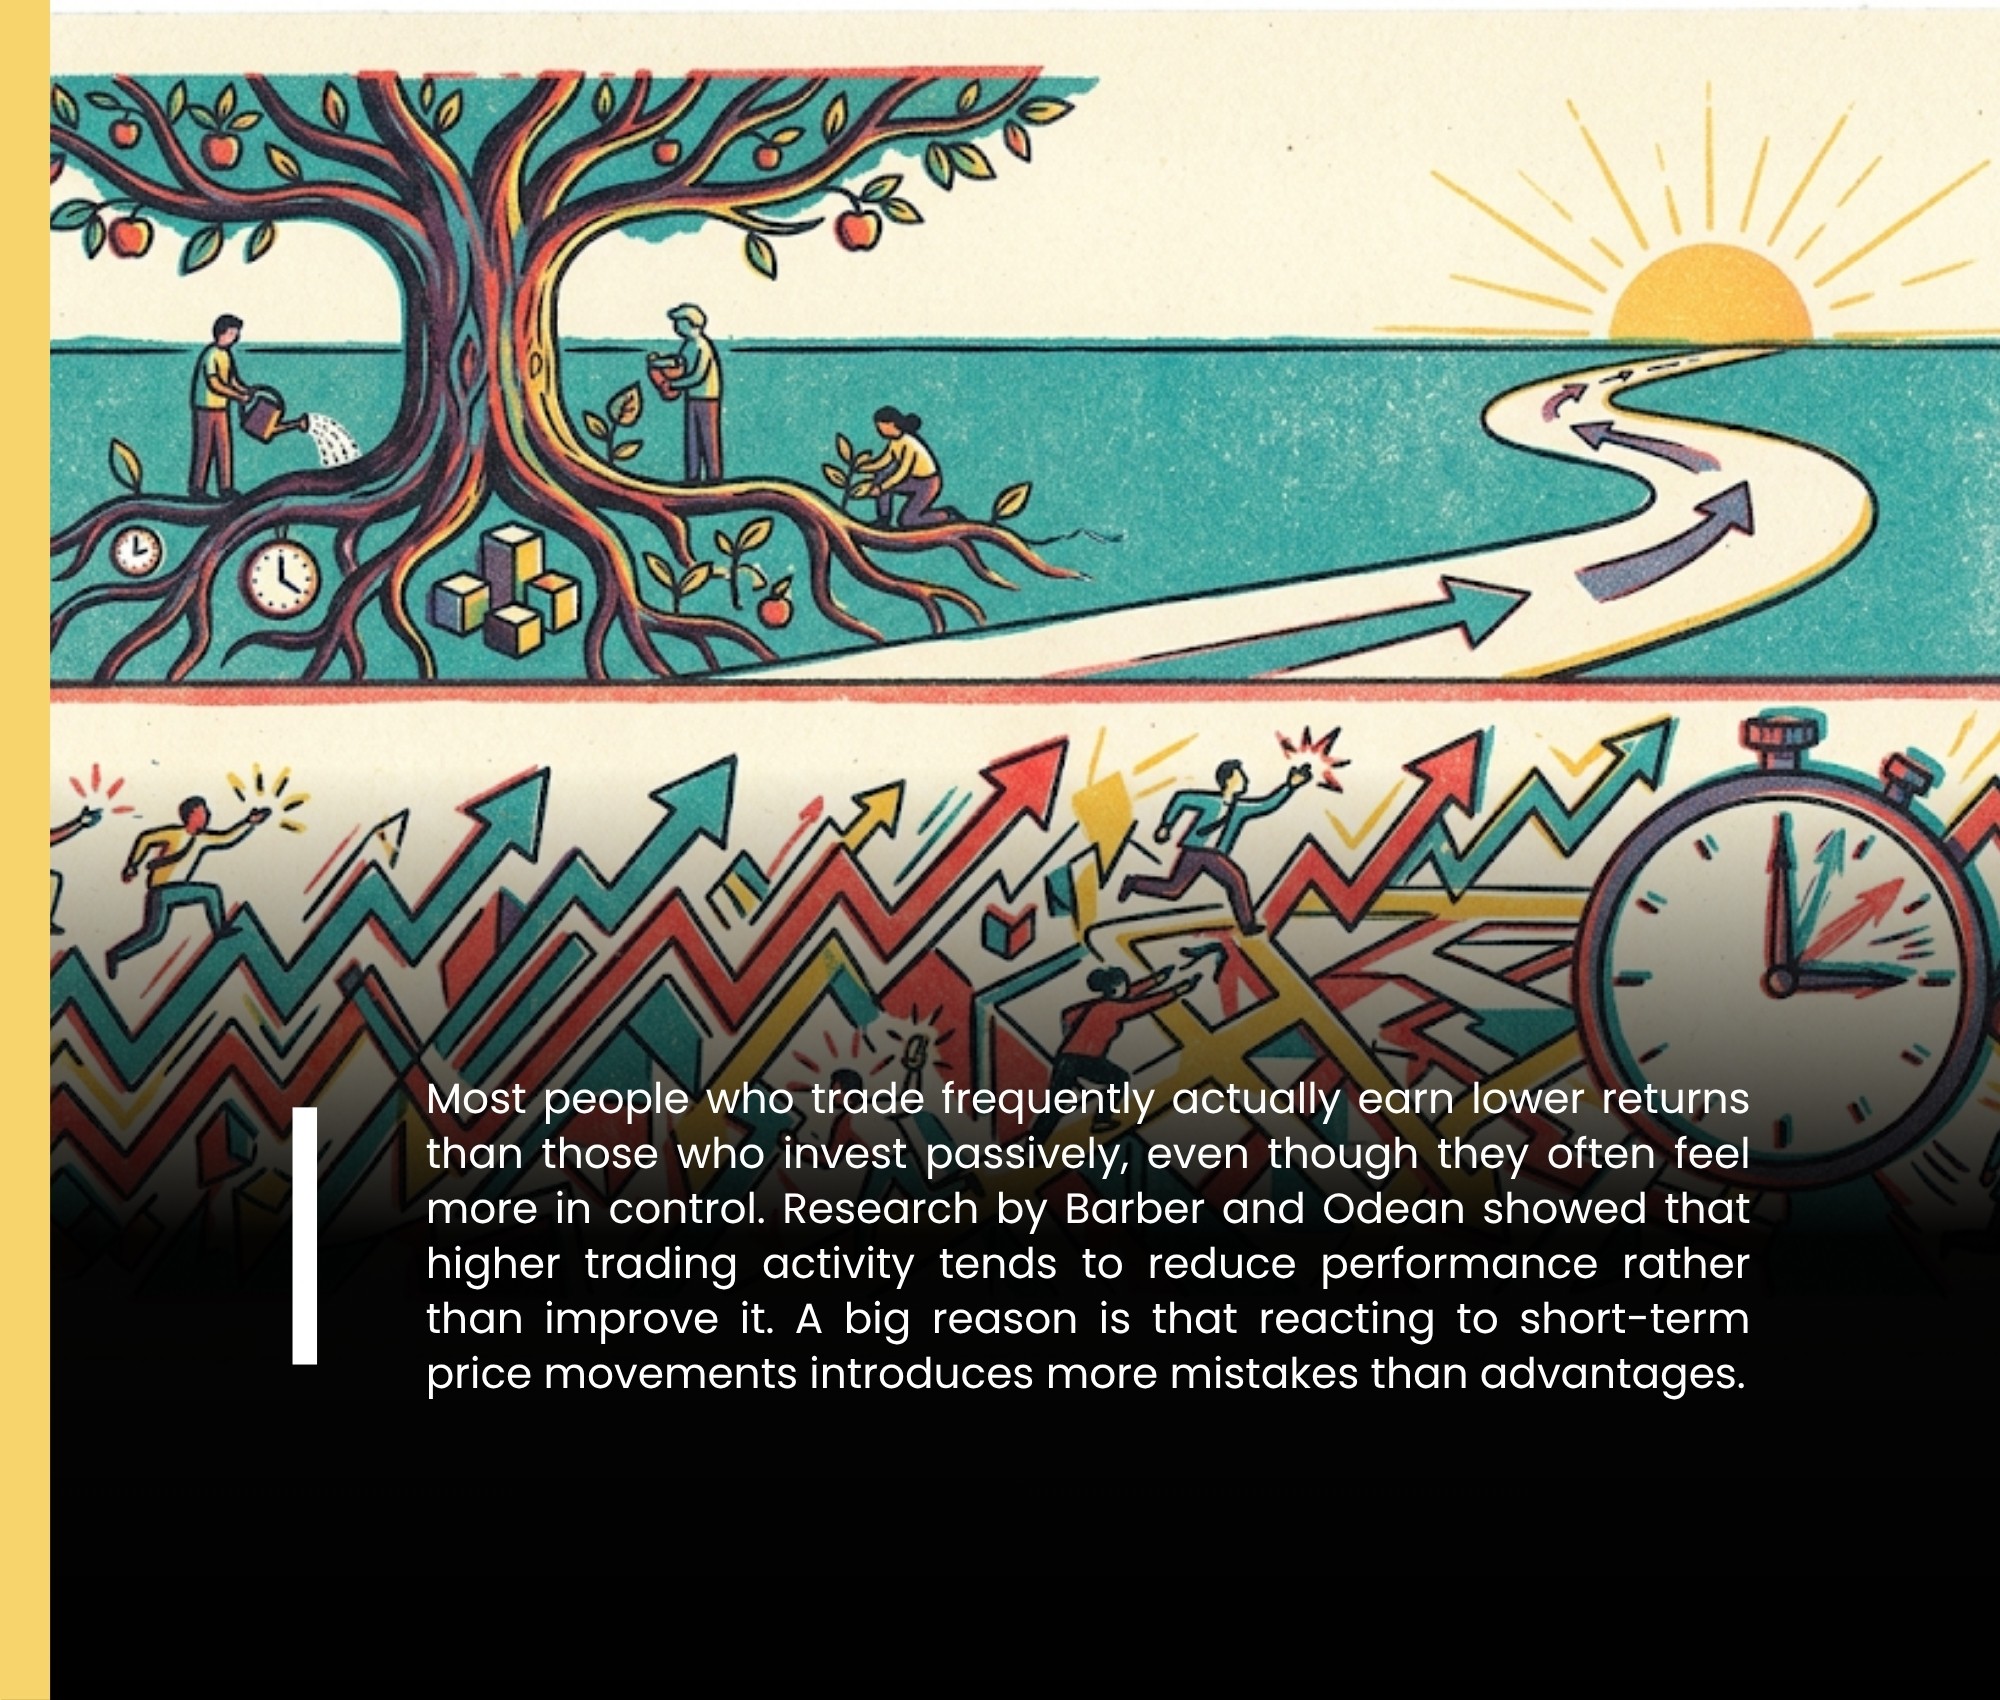
Over-trading low-quality setups: Trading frequency is not correlated with profitability in swing trading. Fewer, higher-quality setups consistently outperform high-frequency mediocre ones.
Neglecting volume on the entry candle: This is the most common error. Trading the pattern without confirming volume is the primary reason retail traders fail with candlestick strategies.
Risk Table — Common Swing Trade Risks and Mitigation Strategies
Risk Factor | Severity | Likelihood | Mitigation Strategy |
|---|---|---|---|
False breakout (pattern fails) |
| Moderate (30-40% of setups) | Pre-defined stop loss, require volume confirmation before entry |
Broad market reversal |
| Low-Moderate | Monitor S&P 500 and VIX daily, reduce position size in elevated volatility |
Earnings gap against position |
| Known in advance | Exit or hedge before scheduled earnings, never hold through unknown binary events |
Overnight gap risk |
| Low (liquid large-caps) | Focus on high-liquidity stocks, avoid thinly traded issues |
Slippage on entry/exit |
| Low | Use limit orders near session open or on pullbacks within the signal candle |
Confirmation bias (seeing patterns that are not there) |
| Moderate | Use a checklist before every entry, require objective criteria to be met in writing |
Trade Management After Entry
Once in a trade, your job shifts from analysis to management. As the position moves in your favor, consider a partial exit (scaling out 50% of the position) at the first resistance target. Move the stop-loss on the remaining position to breakeven or just below a recent swing low. This locks in capital and removes all downside risk on the remaining position.
Use a trailing stop on the second half of the position to capture extended moves. The 21-day EMA is an effective trailing reference on the daily chart: if price closes convincingly below it after a sustained move, exit the remainder.
The Strategic Investor Takeaway
Mastering swing trading with volume and candlesticks is not about finding a magic pattern. It is about building a disciplined, repeatable process that gives you a consistent edge over hundreds of trades. That edge is constructed from three pillars:
Volume context: knowing whether institutional money is supporting or opposing your trade direction.
Candlestick signal quality: only acting on high-probability formations that form at meaningful structural levels.
Risk management precision: defining every trade's maximum loss in advance and sizing positions to protect long-term account survival.
The traders who outperform consistently are not those with the most complex systems. They are the ones who execute a simple, well-defined edge with discipline and patience. The combination of volume and candlesticks, applied at the right price levels with proper risk controls, gives you exactly that edge.
The market will always offer new opportunities. Your most valuable asset as a swing trader is not market knowledge, it is the ability to stay in the game long enough to let your edge compound. Protect your capital fiercely, trade only the best setups, and let volume guide you to where the institutional money is moving.
For more high-probability setups, in-depth market analysis, and a community of serious traders, visit Stock Profit Club. The next winning swing trade setup may already be forming on the chart right now.