Essential Financial Ratios for Analyzing Pharmaceutical Stocks
Posted on
Start Investing
Posted at

Financial Ratios in Pharmaceutical Stock Analysis
Pharmaceutical stock analysis demands more than surface-level metrics because the industry operates on long innovation cycles. A new drug can take 10-15 years and billions in R&D to reach market, yet once approved, it enjoys temporary monopoly pricing that drives exceptional margins. Essential financial ratios for pharmaceutical stocks quantify this dynamic by comparing income-statement items, balance-sheet strength, and market pricing against peers and historical trends.
Investors use these ratios to answer critical questions: Is the company generating enough profit from its R&D spend? Can it survive patent expirations without excessive debt? Is the stock cheap relative to its cash-flow potential? Unlike tech or consumer sectors, pharma typically shows gross margins above 70 percent due to low variable manufacturing costs after fixed R&D is sunk, yet net margins fluctuate with clinical-trial outcomes and regulatory setbacks.
Industry benchmarks from Aswath Damodaran’s data (updated January 2026) show pharmaceutical firms averaging 70.67 percent gross margin, 31.40 percent operating margin, and 26.46 percent net margin, with return on equity around 24 percent. Real companies vary: stable giants like Johnson & Johnson post higher consistency, while growth-oriented names may trade at premium valuations justified by pipelines.
Liquidity ratios matter because cash burn during trial phases can strain short-term resources, even for profitable firms. Solvency ratios highlight debt tolerance, crucial when revenue drops post-patent cliff. Valuation ratios, adjusted for growth via PEG, separate overpriced hype from genuine bargains.
Mastering these essential financial ratios for pharmaceutical stocks turns qualitative pipeline stories into quantifiable conviction. Short paragraphs and targeted examples follow in the next sections. Combine them with qualitative checks on drug pipelines and regulatory filings for best results. Explore additional sector reports on Stock Profit Club.
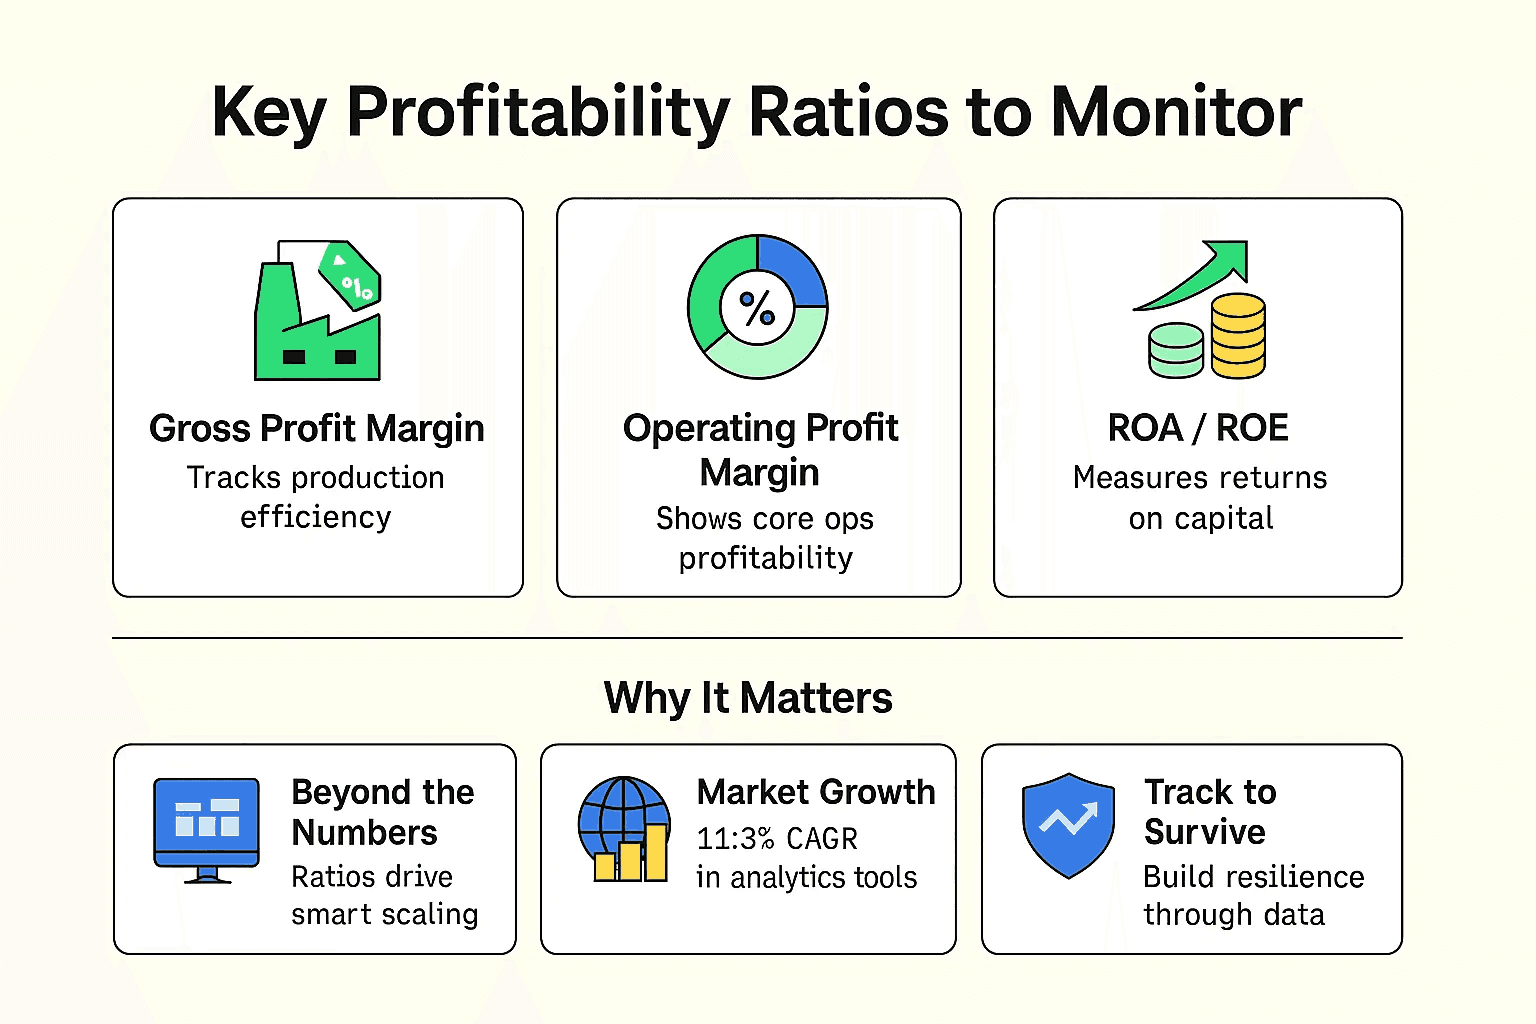
Profitability Ratios Key to Pharma Efficiency
Profitability ratios measure how effectively pharmaceutical companies convert revenue into profit — despite R&D budgets that often consume 15–20% of total sales. These metrics reveal pricing power, cost control, and R&D productivity: the core drivers of long-term pharma success.
Gross Profit Margin
Formula: (Gross Profit ÷ Revenue) × 100
Pharma leaders routinely exceed 70% because active pharmaceutical ingredients cost little once patents lock in exclusivity. A margin below 60% signals manufacturing issues or pressure from generic competition. The industry average sits at 70.67%.
Operating Margin
Formula: (Operating Income ÷ Revenue) × 100
This deducts R&D, selling, and administrative expenses. Strong pharma firms maintain 25–35%, reflecting efficient commercialization. Declines often precede patent cliffs, when marketing spend ramps ahead of new launches.
Net Profit Margin
Formula: (Net Income ÷ Revenue) × 100
Captures taxes and one-time items. Industry averages hover near 23–26%. Recent examples: Johnson & Johnson at 28.46% and Merck at 28.08% show resilience, while Pfizer's 12.42% reflects post-COVID normalization.
Return on Assets (ROA) & Return on Equity (ROE)
ROA Formula: (Net Income ÷ Total Assets) × 100
ROE Formula: (Net Income ÷ Shareholders' Equity) × 100
Pharma ROE averages 24%. Top performers like Merck (36.88%) and Johnson & Johnson (35.03%) excel by leveraging intellectual property without accumulating excessive assets. Pfizer's 8.89% ROE flags temporary pressure.
Return on Research Capital (RORC)
Formula: Current-Year Gross Profit Increase ÷ Prior-Year R&D Spend
A pharma-specific metric. Values above 1.0 indicate successful innovation payback — meaning past R&D investment is generating real profit growth.
Company Snapshot
Merck — Operating margin: 32.77% | ROE: 36.88% Driven by blockbuster oncology drugs.
Johnson & Johnson — Operating margin: 23.97% Steady performance across diversified health segments.
Pfizer — Operating margin: 23.94% | Net margin: 12.42% Lower figures highlight ongoing diversification needs post-patent events.
Investors should track trends over five years, not single quarters. Rising margins signal pipeline success; erosion warns of generic entry. Always compare to industry averages rather than absolute thresholds.
Liquidity and Solvency Ratios for Financial Stability
Pharma companies need strong liquidity to fund multi-year clinical trials, and solid solvency to weather revenue gaps after patent expirations. These ratios confirm short-term survival and long-term debt management in a capital-intensive sector.
Current Ratio
Formula: Current Assets ÷ Current Liabilities
Pharma majors typically maintain 1.0–2.0 — lower than other industries because receivables and inventory turn reliably. Current ratios: Johnson & Johnson 1.03, Pfizer 1.16, Merck 1.54 — all adequate, signaling tight but disciplined cash management.
Quick Ratio
Formula: (Cash + Receivables) ÷ Current Liabilities
Excludes inventory. Values near or above 1.0 comfort investors when regulatory delays threaten cash timing.
Debt-to-Equity Ratio
Formula: Total Debt ÷ Shareholders' Equity
Moderate leverage is normal in pharma, often used to fund acquisitions. Current figures: Johnson & Johnson 60.50%, Pfizer 77.96%, Merck 95.96%. Ratios above 100% raise flags when paired with falling margins.
Interest Coverage Ratio
Formula: EBIT ÷ Interest Expense
Should exceed 5.0 for safety. Strong coverage protects against rate hikes or unexpected revenue drops.
EV/EBITDA
Bridges valuation and solvency analysis. Lower multiples paired with strong interest coverage indicate resilient balance sheets.
Key Insight
High debt works in pharma when backed by predictable cash flows from approved drugs — but patent cliffs amplify risk. Merck's higher debt-to-equity pairs with superior ROE and margins, demonstrating smart leverage. Pfizer's moderate debt supports recovery potential given its low forward valuation.
Monitor these ratios quarterly alongside cash-burn rates from R&D pipelines. Use them alongside profitability metrics to avoid value traps.
Valuation Ratios to Determine Pharma Stock Worth
Valuation ratios answer a core question: is this stock trading at a fair price relative to earnings, sales, book value, or cash flow? Pharma often commands premiums for growth pipelines — so always adjust for forward estimates and PEG.
Trailing vs. Forward P/E
Trailing P/E Formula: Stock Price ÷ TTM EPS Forward P/E: Uses analyst estimates for future visibility.
Merck's trailing P/E of 15.73 reflects current strength; its forward P/E of 22.37 anticipates growth moderation. Pfizer's forward P/E of 9.28 signals deep value — if the pipeline delivers.
PEG Ratio
Formula: P/E Ratio ÷ Expected EPS Growth Rate
Below 1.0 signals undervaluation. Johnson & Johnson's 1.66 appears reasonable given its steady 35.03% ROE.
Price-to-Sales (P/S)
Formula: Market Cap ÷ TTM Revenue
Useful across the maturity spectrum. Pfizer's 2.49 looks attractive versus Johnson & Johnson's 6.12 premium.
Price-to-Book (P/B)
Compares market value to net assets. Less reliable in pharma due to intangible-heavy balance sheets — but Merck's 5.38 and Johnson & Johnson's 7.01 reflect strong brand equity.
EV/EBITDA
Formula: Enterprise Value ÷ EBITDA
Ignores capital structure differences. Merck: 11.25 | Pfizer: 12.26 | Johnson & Johnson: 14.60 — all near industry norms. Lower figures indicate cheaper entry points.
Valuation Multiples at a Glance (Late 2025)
Company | Trailing P/E | Forward P/E | PEG (5yr) | P/S | P/B | EV/EBITDA |
|---|---|---|---|---|---|---|
Pfizer (PFE) | 20.09 | 9.28 | 13.77 | 2.49 | 1.80 | 12.26 |
Johnson & Johnson (JNJ) | 21.51 | 20.58 | 1.66 | 6.12 | 7.01 | 14.60 |
Merck (MRK) | 15.73 | 22.37 | 3.49 | 4.42 | 5.38 | 11.25 |
Lower multiples with strong profitability and pipeline visibility highlight opportunities. High PEGs warn of overvaluation unless breakthrough drugs emerge. Cross-reference with profitability and solvency ratios for confirmation.
Takeaways for Pharma Investors
Integrating essential financial ratios for pharmaceutical stocks requires a multi-ratio scorecard. Score companies on profitability (>25 percent operating margin preferred), liquidity (current ratio >1.0), solvency (debt/equity <100 percent with coverage >5), and valuation (PEG <2.0 and EV/EBITDA <15). Weight forward metrics heavily because pipelines drive future cash flows.
Screen first on low forward P/E combined with rising ROE and stable debt. Then verify liquidity covers at least two years of R&D. Finally, calculate RORC to confirm innovation efficiency. This layered approach filters noise from clinical-trial headlines.
Risk Table for Pharmaceutical Stock Ratios
Risk Factor | Ratio Impact | Pharma Example | Mitigation Strategy |
|---|---|---|---|
Patent Cliff Revenue Drop | Falling margins, ROE, and coverage | Post-Lipitor Pfizer margin compression | Diversified pipeline and M&A |
Regulatory Delays | Lower liquidity and higher debt reliance | Trial failures stretching cash | Monitor quick ratio and R&D spend ratio |
High Leverage During Downturn | Elevated debt/equity and weak interest coverage | Debt-funded acquisitions amid generic pressure | Require coverage >5 and track EV/EBITDA |
Overvalued Growth Hype | Inflated PEG and P/E | Speculative biotech run-ups | Cross-check with profitability and ROE trends |
Even strong ratios fail without qualitative overlay: robust Phase III pipelines, diversified therapeutic areas, and experienced management. A low P/E alone misses pipeline voids, while high ROE with expiring patents signals temporary strength.
Strategic investor takeaway: Use these essential financial ratios for pharmaceutical stocks to build a resilient portfolio blending value (low forward multiples, solid liquidity) and quality (high ROE, consistent margins). Rebalance quarterly as new approvals or cliffs emerge. This disciplined, ratio-driven process outperforms sector benchmarks over cycles by avoiding hype and capturing fundamental value.
Ready to apply these insights? Explore more expert content, stock picks, and interactive ratio screeners on Stock Profit Club today.