Mastering Stock Market Volatility
Posted on
Start Trading
Posted at

Understanding Stock Market Volatility and Why Indicators Matter
Stock market volatility measures the degree of variation in trading prices over time. It captures how rapidly and sharply asset values swing, creating both risk and opportunity for investors. High volatility periods often coincide with economic uncertainty, geopolitical events, or sudden shifts in investor sentiment, while low volatility environments signal stability and steady growth.
For retail and serious investors alike, volatility is not just noise, it directly impacts portfolio performance, option pricing, stop-loss placement, and entry-exit timing. Ignoring it can lead to unexpected drawdowns, while mastering it allows proactive positioning.
Market indicators that reflect volatility provide quantifiable signals. These tools translate raw price action into actionable insights, helping you assess whether the market is calm, choppy, or storming. They range from forward-looking implied measures to backward-looking historical ones, and from broad-market gauges to security-specific metrics.
Understanding these indicators equips you to adjust position sizes, deploy hedges, or identify mean-reversion setups. In 2026, with ongoing macroeconomic pressures, these tools remain essential for preserving capital and generating alpha.
The VIX Index: Wall Street’s Premier Fear Gauge
The CBOE Volatility Index, universally known as the VIX, stands as the most recognized market indicator that reflects volatility in the stock market. Often called the “fear gauge,” it calculates the market’s expected 30-day annualized volatility for the S&P 500 based on a wide range of SPX put and call option prices.
Unlike historical measures, the VIX is forward-looking. It derives from the implied volatility embedded in options premiums, reflecting collective investor expectations for upcoming price swings. A VIX reading below 15 typically signals complacency and low fear, readings between 15 and 25 indicate normal market conditions, while levels above 30 point to elevated uncertainty and potential turbulence.
As of early March 2026, the VIX trades around 21-23 after recent swings, with a 52-week range of 13.38 to 60.13. This moderate level suggests guarded optimism rather than panic, yet it remains elevated compared to pre-2020 norms. For real-time tracking, check the VIX on Yahoo Finance.
Historical spikes illustrate its power. During the 2008 Global Financial Crisis, the VIX surged to a closing high of 80.86. In March 2020 amid COVID-19 lockdowns, it peaked at 82.69. More recently, tariff-related tensions in April 2025 pushed it above 52. These episodes show the VIX often rises sharply as equities fall, offering an inverse relationship that makes it an effective hedging signal.
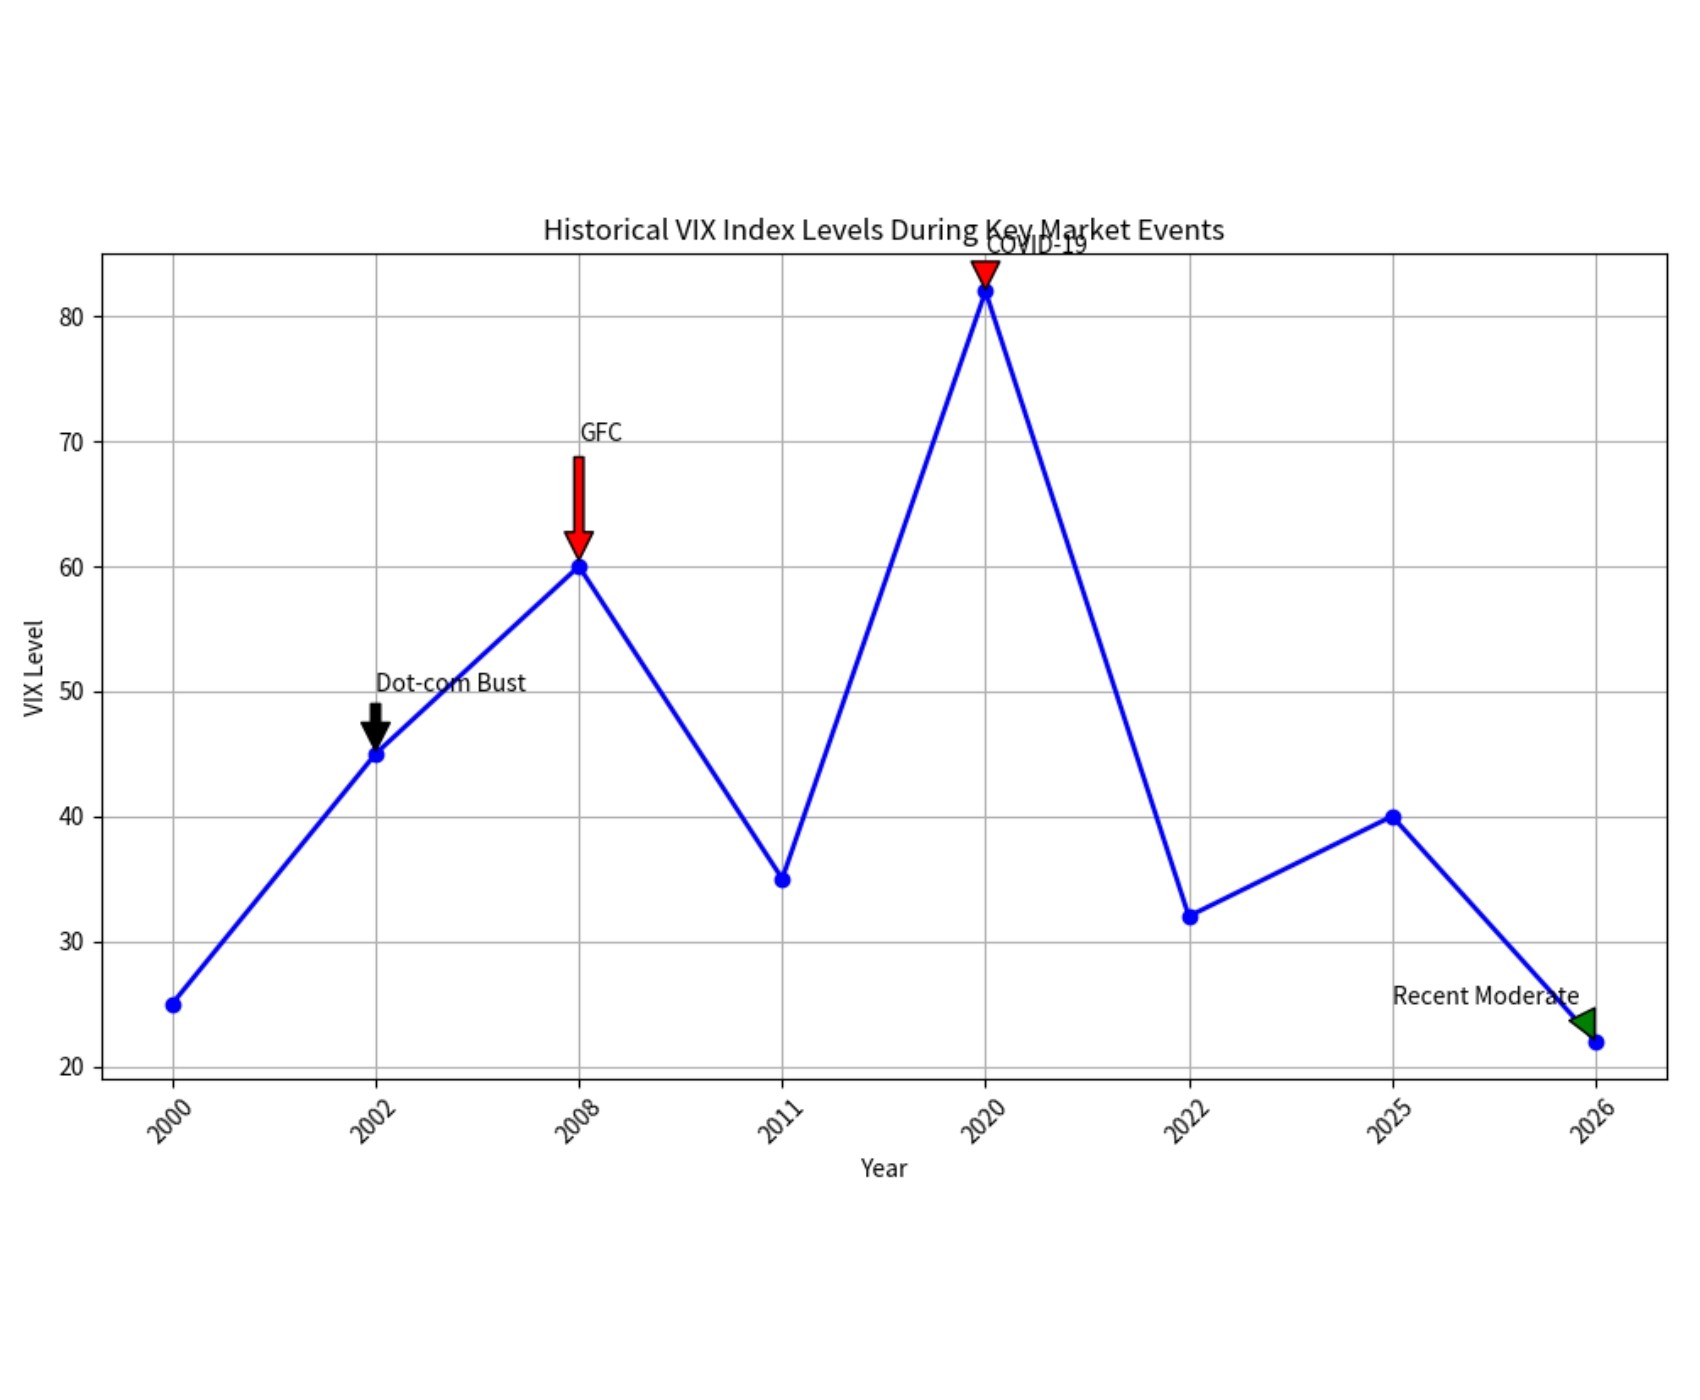
Historical VIX Peaks During Major Events (Data Table)
Event | Year | Peak VIX Close | S&P 500 Approximate Drawdown |
|---|---|---|---|
Dot-com Bust Aftermath | 2002 | ~45 | -49% (peak to trough) |
Global Financial Crisis | 2008 | 80.86 | -57% |
COVID-19 Crash | 2020 | 82.69 | -34% in one month |
Inflation/Tariff Shock | 2025 | ~52 | -15%+ (intra-year) |
Current (March 2026) | 2026 | ~23 | Moderate conditions |
Investors use the VIX in multiple ways. Portfolio managers buy VIX futures or options when readings climb above 25 to offset equity downside. Traders watch for VIX mean reversion, selling volatility when it spikes excessively. Serious investors monitor the term structure, comparing short-term VIX to longer-dated measures like the VXV for clues on persistence of fear.
The VIX shines as a broad-market sentiment tool but has limitations, it focuses solely on S&P 500 expectations and can remain elevated even after initial shocks subside. Combine it with other indicators for robust analysis.
Technical Volatility Indicators for Precision Trading
Beyond the VIX, several technical market indicators that reflect volatility help traders zoom in on individual securities or short-term price behavior.
Average True Range (ATR) quantifies average daily price movement over a typical 14-period window, accounting for gaps between sessions. Developed by J. Welles Wilder, ATR rises during explosive moves and contracts in quiet consolidation. A stock with ATR of 3% on a $100 price implies daily swings of roughly $3. Traders use ATR multiples (1x, 2x, or 3x) to set dynamic stop-losses or profit targets that adapt to current conditions rather than fixed dollar amounts.
Bollinger Bands, created by John Bollinger, consist of a 20-period simple moving average flanked by two standard deviation bands. The bands expand during high-volatility phases and squeeze tightly during low-volatility periods. A “Bollinger Band Squeeze” often precedes powerful breakouts, signaling impending volatility expansion. When price tags the upper band in an expanding setup, momentum traders take note, yet overextended moves may warn of reversals.
Chaikin Volatility and Historical Volatility add further layers. Chaikin measures the widening or narrowing of the high-low range over time, highlighting shifts in trader enthusiasm. Historical volatility calculates the annualized standard deviation of daily returns, offering a pure statistical view of past price behavior for comparison against implied volatility.
These indicators complement the VIX by providing granular, security-level insights. For example, a broad-market VIX spike paired with contracting ATR on major indices may suggest the volatility is concentrated in specific sectors rather than uniform panic.
Interpreting Volatility Signals
Successful investors integrate multiple market indicators that reflect volatility into cohesive frameworks. Start by establishing baselines: note the prevailing VIX regime, then layer ATR for position sizing and Bollinger Bands for timing.
Comparison of Key Volatility Indicators (Data Table)
Indicator | Measures | Time Horizon | High Reading Signals | Best Application |
|---|---|---|---|---|
VIX | Implied S&P 500 vol | 30 days | Market-wide fear | Portfolio hedging, sentiment |
ATR | Daily price range | 14 periods | Explosive individual moves | Stop-loss placement, trade sizing |
Bollinger Bands | Standard deviation bands | 20 periods | Expansion or squeeze | Breakout detection, reversals |
Historical Vol | Past return std dev | Custom | Elevated past turbulence | Options pricing comparison |
Chaikin Volatility | High-low range expansion | 10 periods | Increasing trader indecision | Short-term momentum confirmation |
When VIX exceeds 30 and ATR doubles on blue-chip names, reduce overall exposure and favor defensive sectors. Conversely, prolonged low VIX below 15 with contracting Bollinger Bands often precedes volatility expansion, ideal for buying dips or initiating trend-following positions.
Impact of Volatility on Stock Valuation Multiples (Valuation Table)
Volatility Regime (VIX) | Typical Market Forward P/E | Risk Premium Effect | Investor Action |
|---|---|---|---|
Low (<15) | 22-26x | Compressed | Favor growth stocks, higher leverage |
Moderate (15-25) | 18-22x | Neutral | Balanced allocation |
High (>30) | 12-16x | Expanded discount | Shift to value, defensives, cash |
Higher volatility demands lower multiples as investors demand greater compensation for uncertainty, creating buying opportunities once fear subsides.
Risk Scenarios Based on Volatility Signals (Risk Table)
Signal Combination | Risk Level | Expected Drawdown Potential | Recommended Mitigation Strategy |
|---|---|---|---|
VIX >30 + ATR expansion | High | 15-30% | Buy protective puts, reduce beta exposure |
Bollinger Squeeze + low VIX | Medium | Breakout volatility spike | Prepare directional trades, tighten stops |
Sustained VIX <15 + narrow ATR | Low | Complacency reversal | Gradually increase allocation, monitor for spikes |
Divergence (high VIX, low ATR) | Medium | Sector-specific stress | Sector rotation, focus on low-vol names |
Practical strategies include volatility targeting, where you adjust equity exposure inversely to VIX levels to maintain constant portfolio risk. Options traders sell premium when implied volatility exceeds historical volatility, collecting theta while volatility mean-reverts. Long-term investors use these signals to rebalance quarterly, trimming winners during calm periods and adding during fear-driven selloffs.
Always backtest combinations on your preferred assets. No single indicator is infallible, but convergence across VIX, ATR, and Bollinger Bands dramatically improves signal reliability.
Volatility Insights into Lasting Investment Edge
Market indicators that reflect volatility empower serious investors to move from reactive to proactive. By monitoring the VIX for broad sentiment, ATR for trade management, and Bollinger Bands for timing, you gain clarity amid uncertainty.
The strategic takeaway is simple yet powerful: treat volatility as a feature, not a bug. Use elevated readings to buy quality assets at discounted valuations, deploy hedges when fear peaks, and scale into positions during compression phases that precede trends. In 2026’s environment of persistent macro crosscurrents, this disciplined approach separates consistent performers from those whipsawed by swings.
Master these tools, maintain emotional discipline, and volatility becomes your ally for superior risk-adjusted returns.
Ready to sharpen your edge? Explore advanced stock analysis, volatility-based screeners, and expert market commentary at Stock Profit Club.